Hi, We are UNIKO's hardware!
The much-awaited 16c/32t Chipzilla, the Ryzen 9 3950X, is finally being released. This processor is the AM4 platform's "Ace in the hole" against Intel's HEDT X299 platform. Let's take this chip through our test suite to see how powerful it truly is.
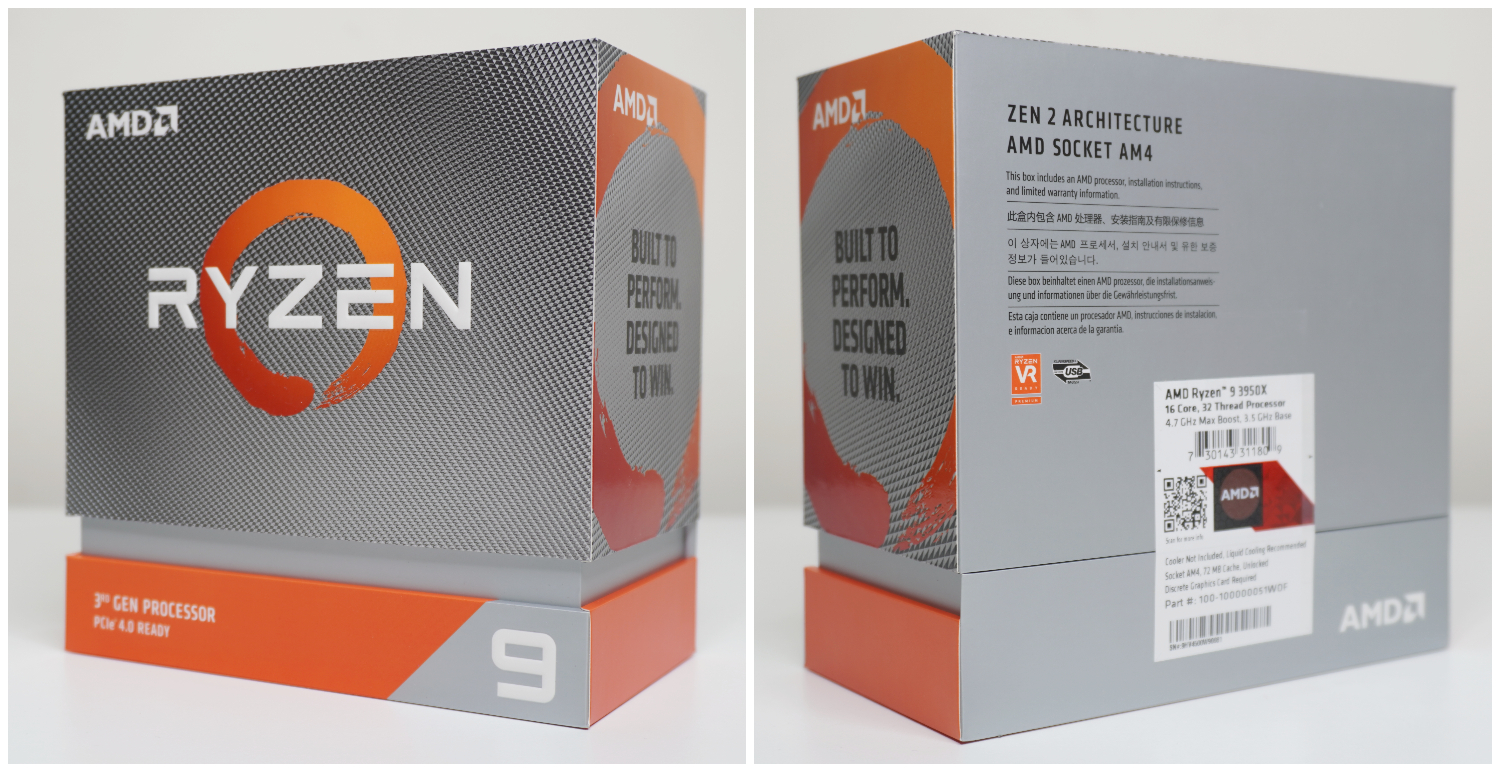
R9 3950X packaging & content overview
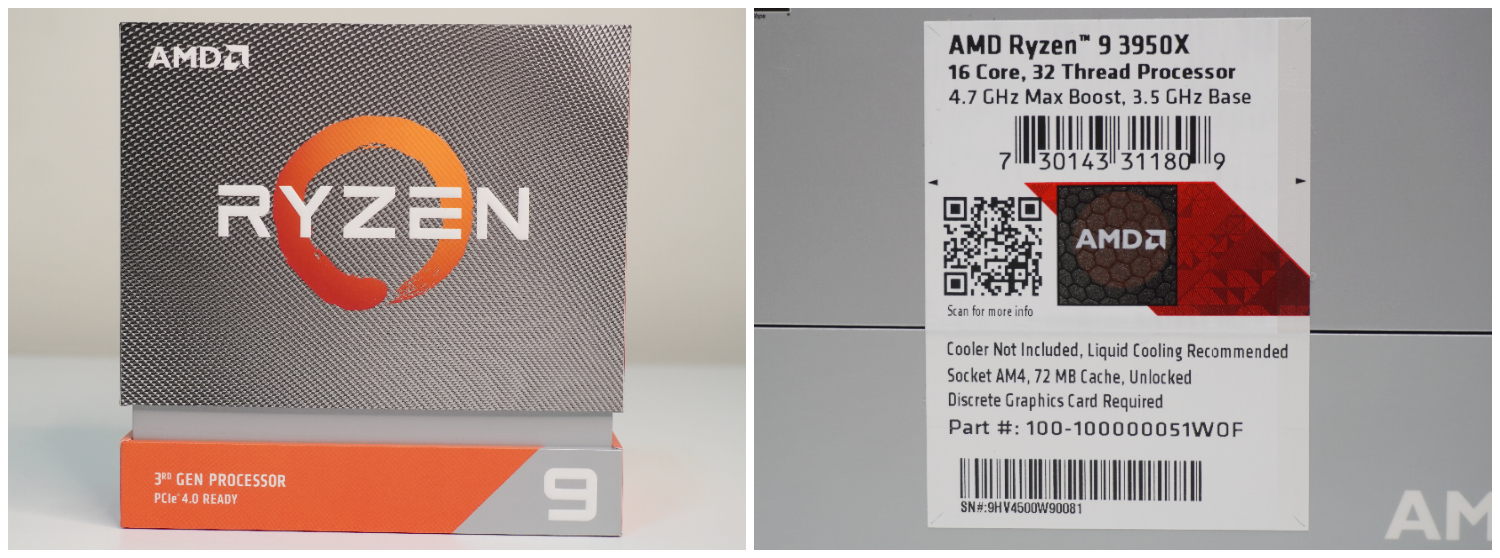
▲The packaging has been shrunk down since it does not come with a stock cooler. We suggest a 280mm AIO liquid cooler for this little beast.
▲16 core 32 thread of pure awesomeness!!!
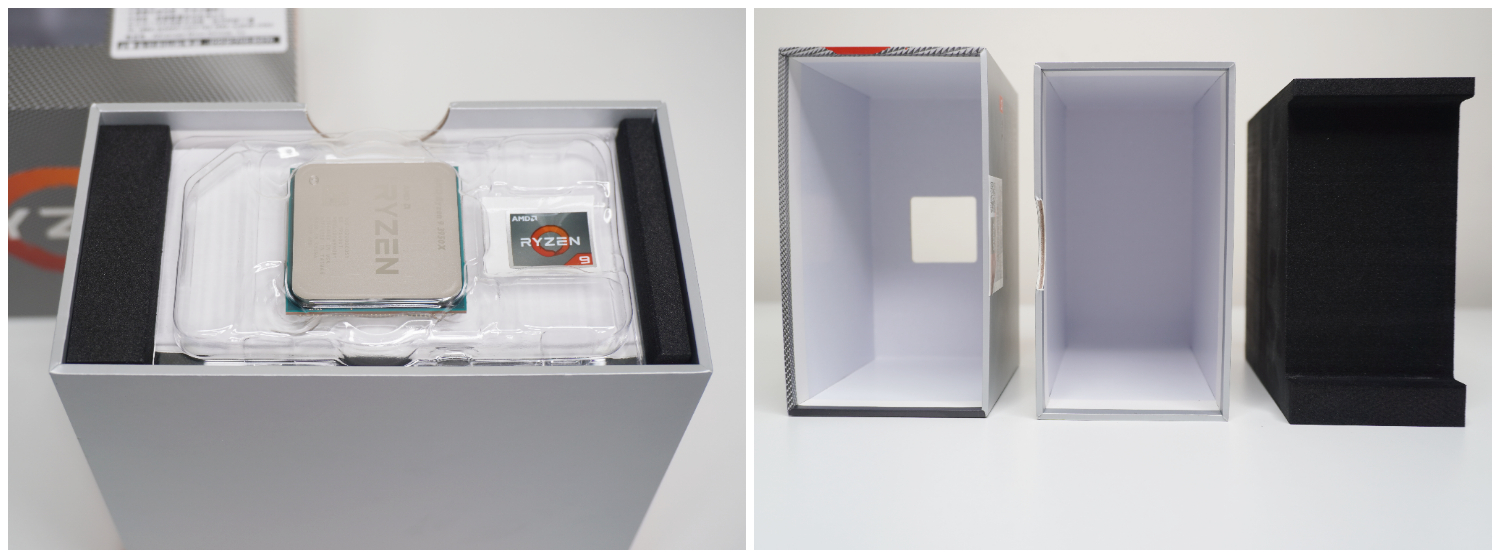
▲AMD has filled most of the box with a protective black foam which holds the plastic tray containing the CPU.
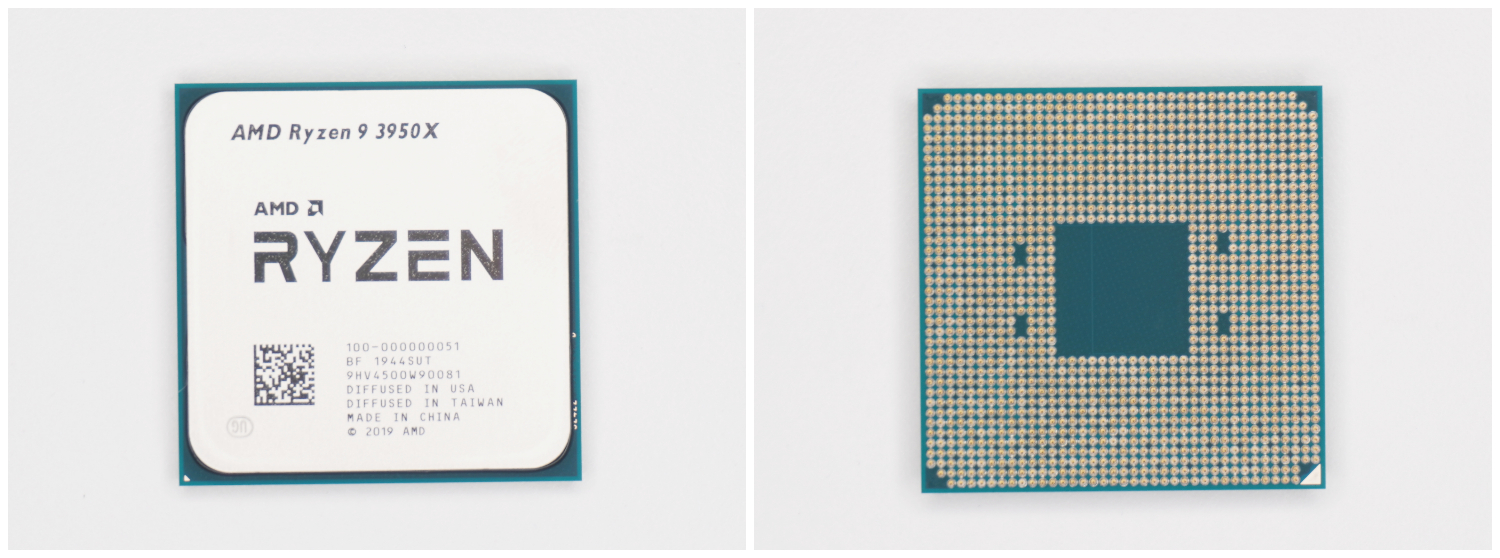
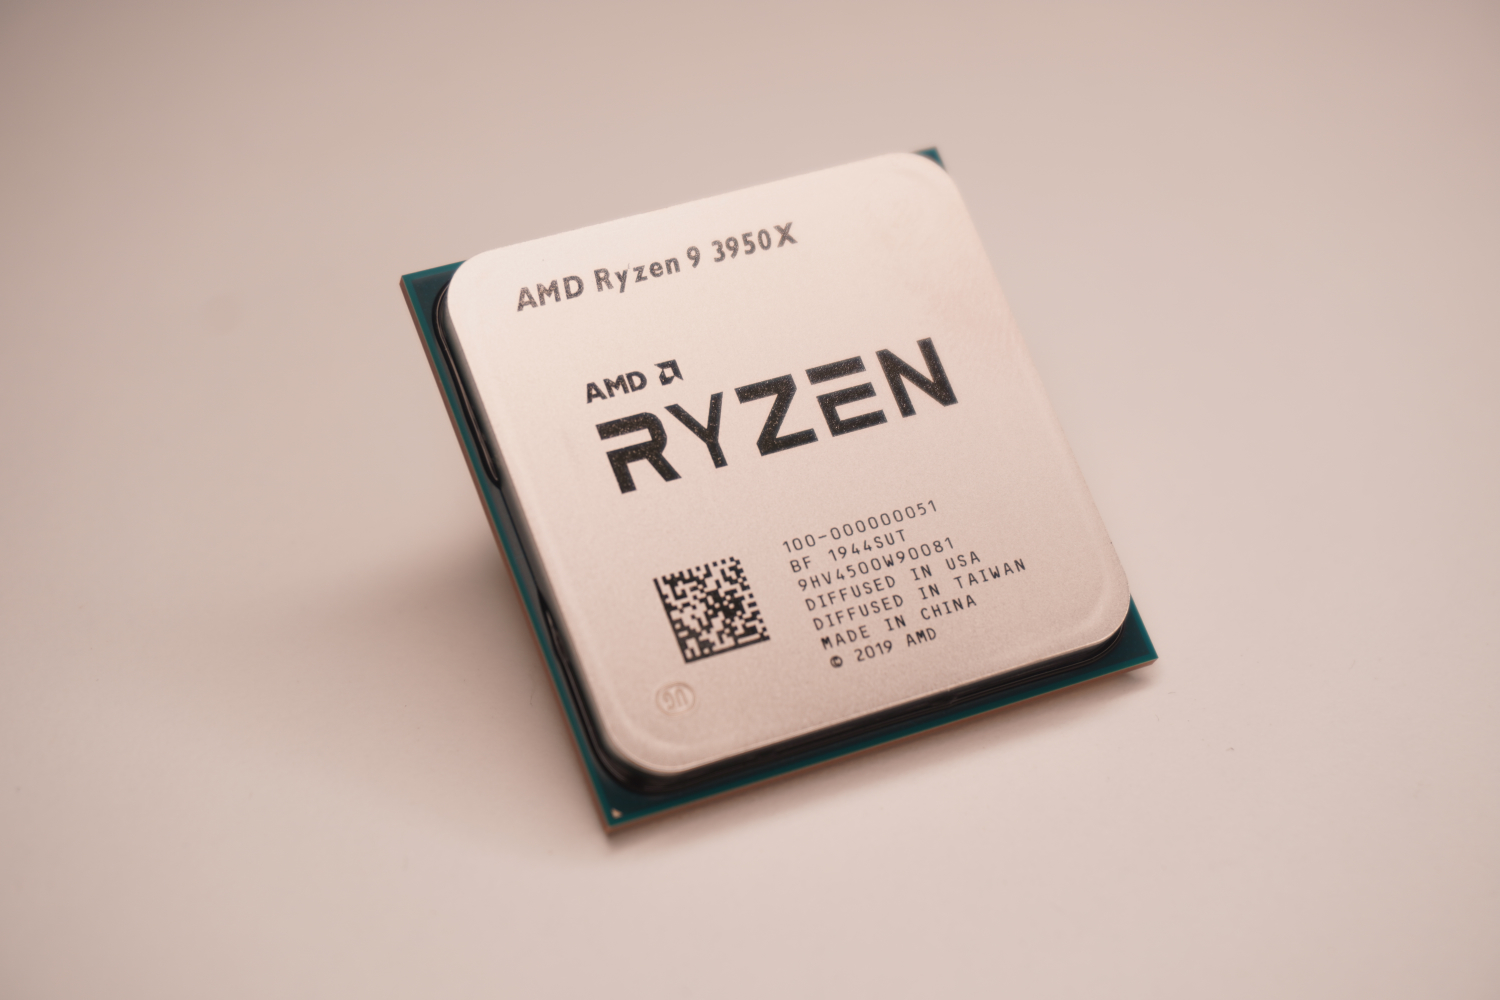
▲Front/Back view of the R9 3950X. Here you can see all the 1,331 pins that will be slotted in the AM4 socket.
▲The R9 3950X is undoubtedly a milestone in the history of processors!
Ryzen 9 3950X technical key points
▲The Ryzen 9 3950X features 16cores and 32 threads. The base clock is 3.5 GHz and it will boost itself up to 4.7 GHz. It also features 72MB of L2+L3 Cache with the whole CPU having a TDP of 105W.
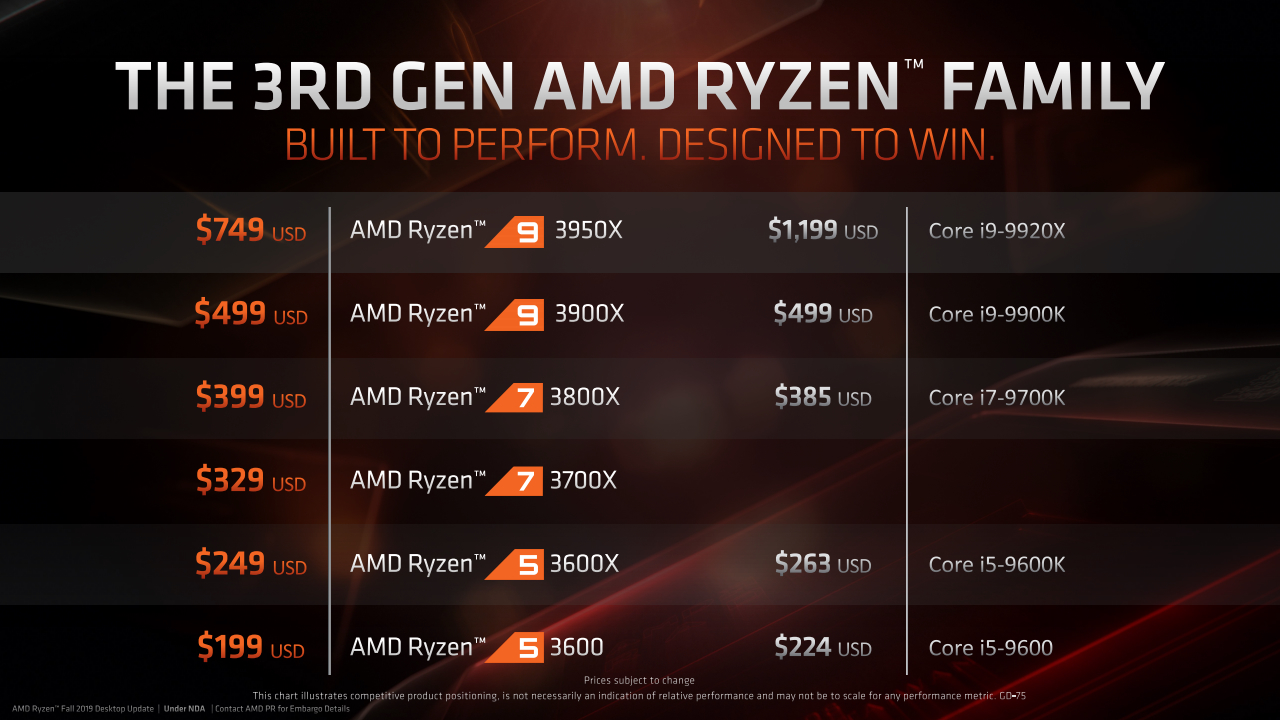
▲AMD has priced the 3950X at USD 749, making it much more affordable than its competitor - the Intel Core i9-9920X.
▲Unlike its other Ryzen 3000 series brethren, the R9 3950X does not include a stock cooler out of the box. This is understandable since we are talking about a 16 core processor. AMD recommends a 280mm AIO liquid cooler for this chip, but during our testing, we found out that you will be fine if you use a decent tower-style air cooler.
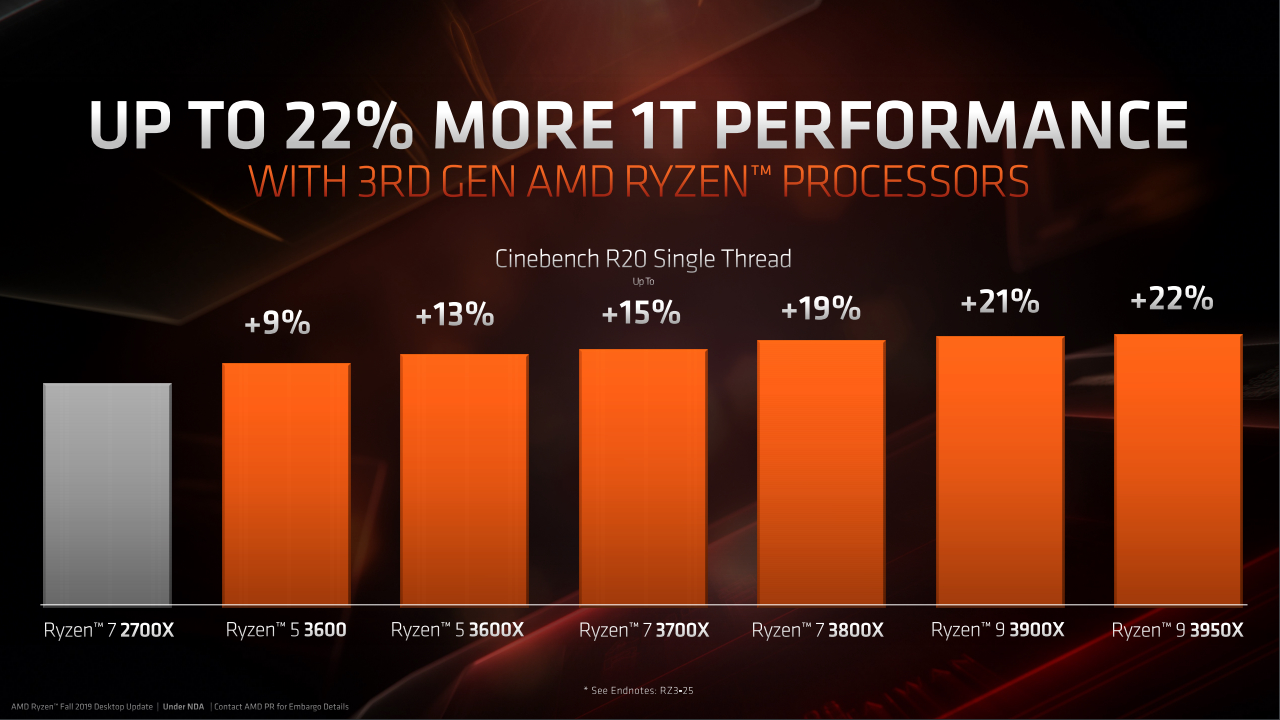
▲AMD claim in their Cinebench R20 single-thread testing that the R9 3950X offers 22% more performance than the previous king - the Ryzen 7 2700X.
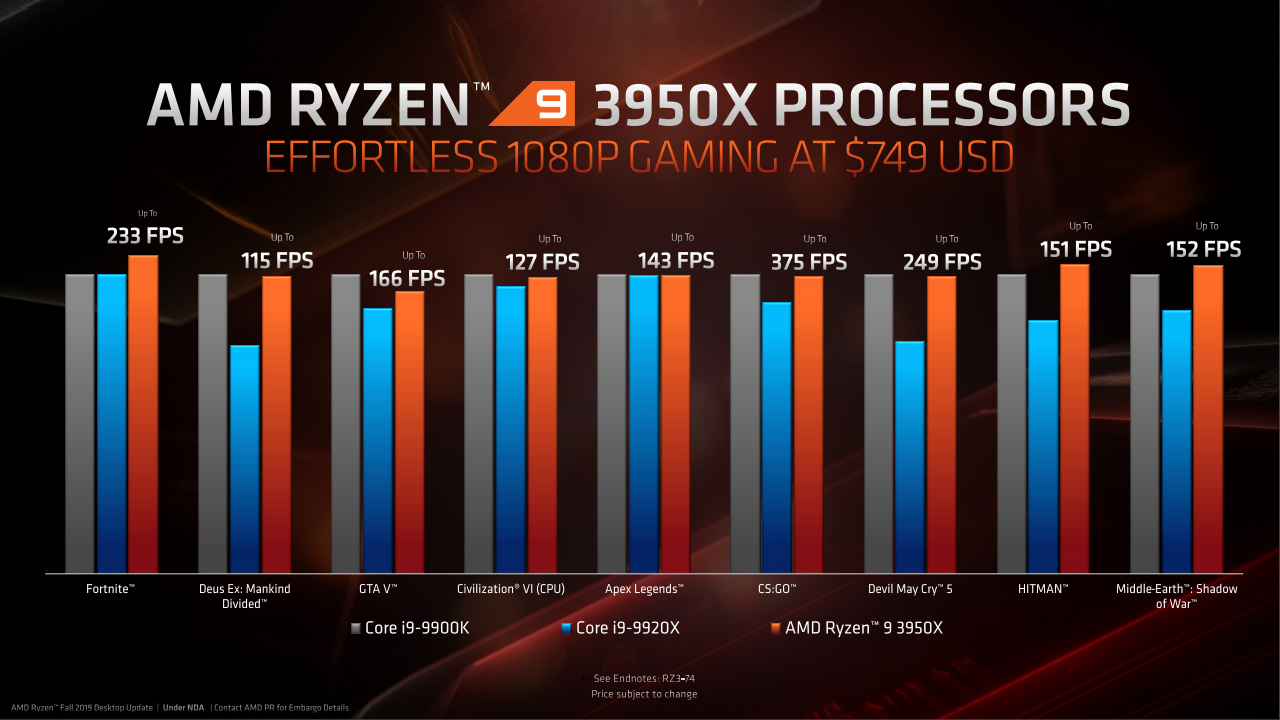
▲AMD also show off some of their gaming benchmarks at 1080P putting the R9 3950X against the i9-9900K and the i9-9920X.
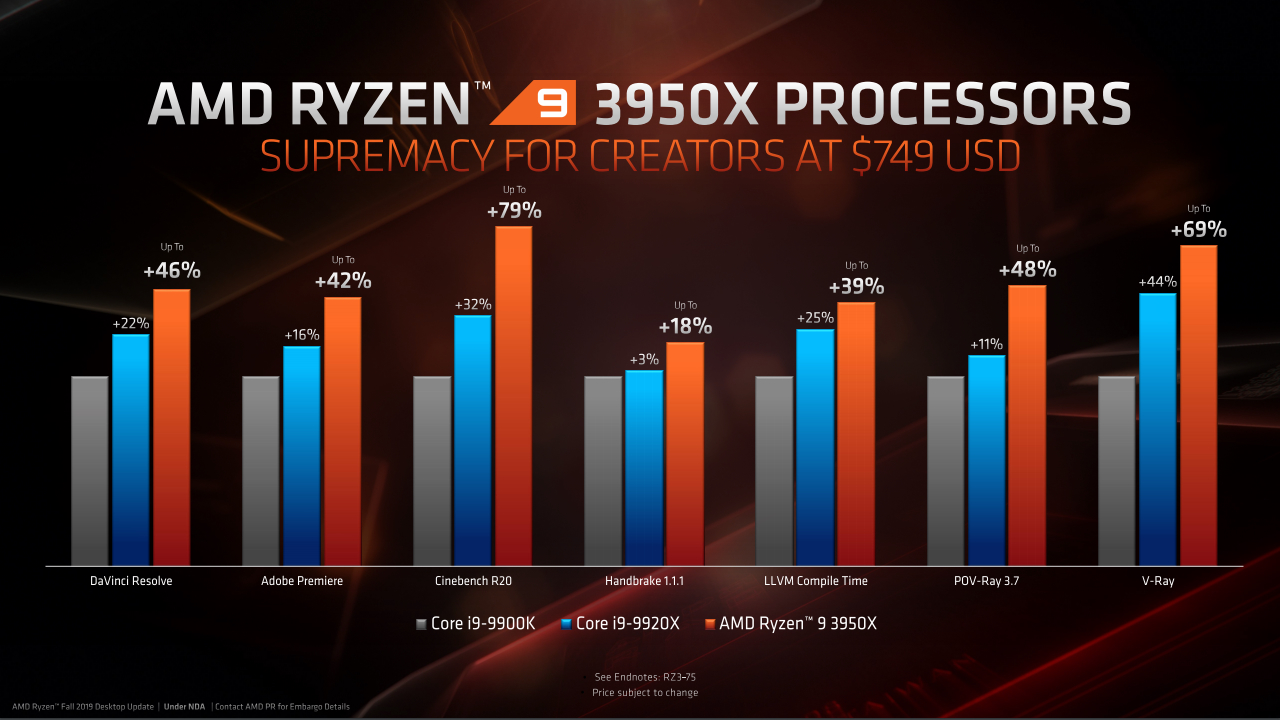
▲Here’s how the Ryzen 9 3950X stacks up against the i9-9900K and i9-9920X in some productivity workloads.
▲The Ryzen 9 3950X boasts some pretty impressive power efficiency as well. Compared to the 9900K and the 9920X, the R9 3950X offers more than 2.34X performance per Watt and much lower ~173W compared to the two other candidates in Cinebench R20 nT.
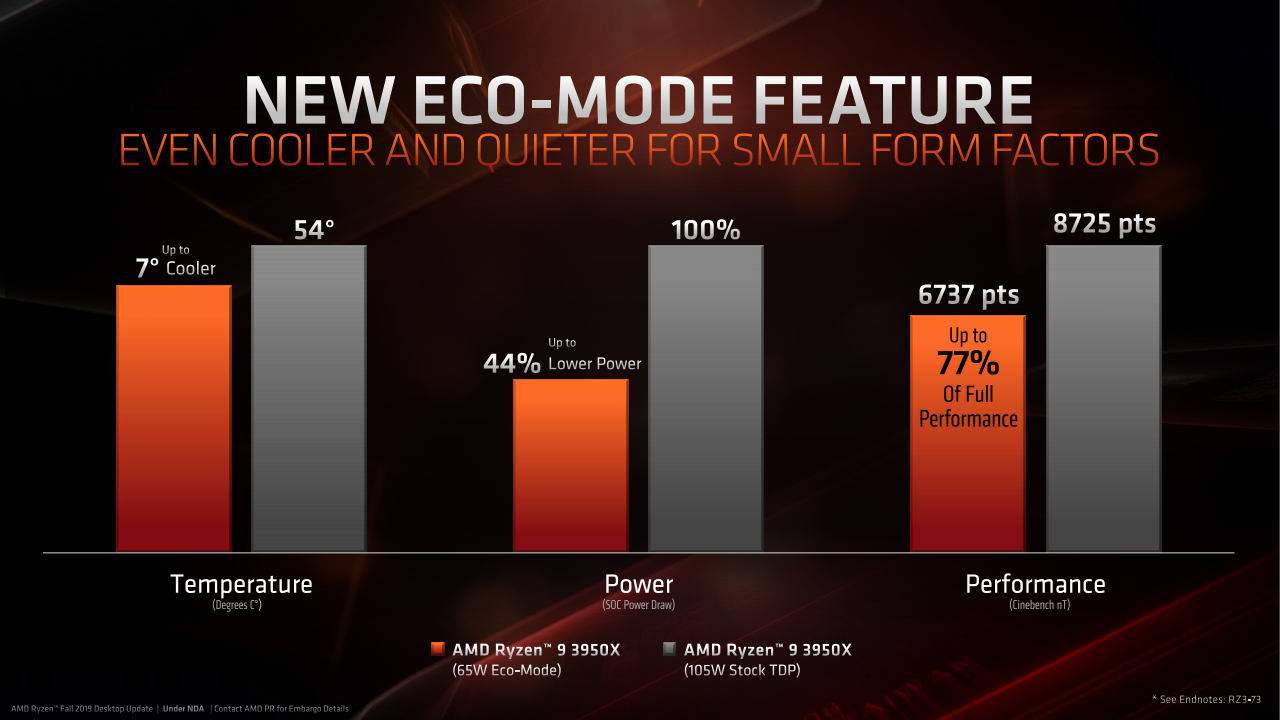
▲With the arrival of the R9 3950X, RyzenMaster also gets a new feature called “ECO-MODE”. When it is turned on, the chip will run up to 7 degrees cooler, have up to 44% lower power consumption while maintaining up to 77% of its full performance.
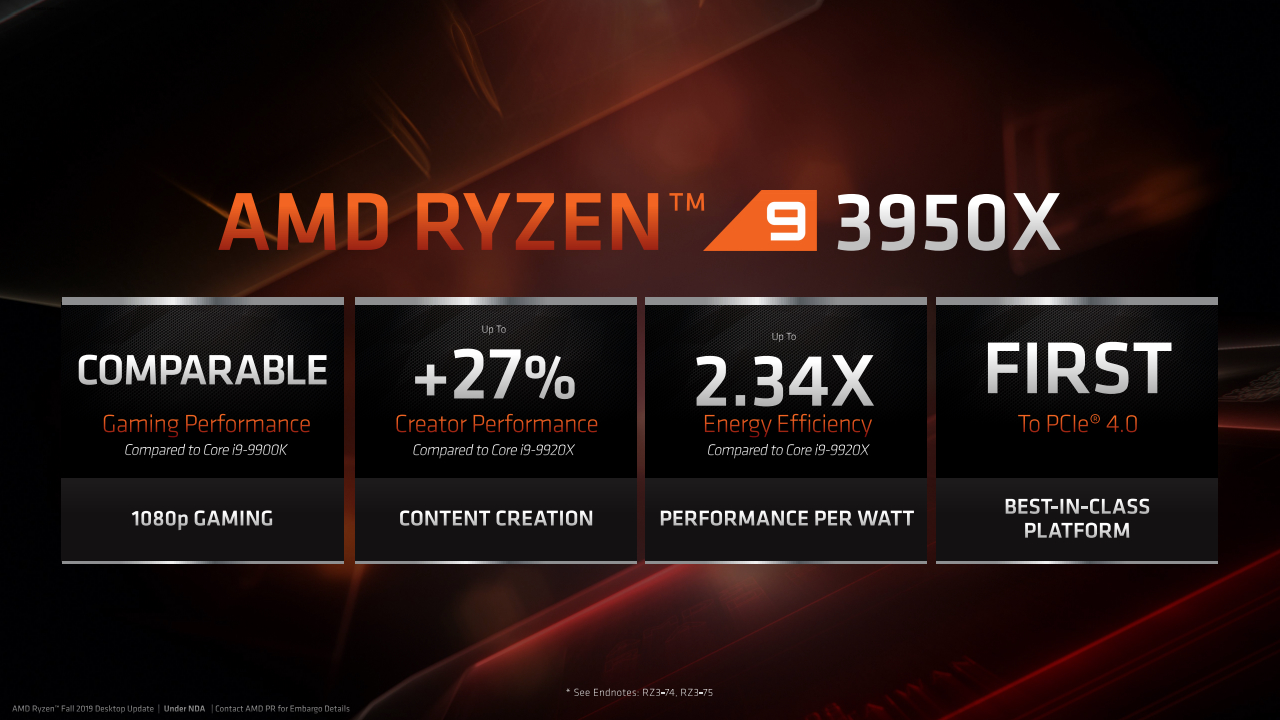
▲Finally, the R9 3950X has comparable gaming performance to the 9900K at 1080P. Meanwhile, it offers 27% more performance in productivity-related tasks compared to the 9920X and has a lead of 2.34X energy efficiency over it. The R9 3950X is also the first 16 core CPU to use the high bandwidth PCIe 4.0 standard available to its platform.
Ryzen Master overclocking software
▲In this tab, there are 5 modes you can choose from. If you choose to manually overclock your CPU, you can change the core frequencies and the voltage here. You can also make changes to your DRAM settings as well.
Test setup & Benchmark results
Windows 10 settings
- Win10 1909.
- UAC – OFF.
- Windows Defender – OFF.
- Screen saver – OFF.
- Power plan – 1usmus Ryzen Universal.
- Hibernate - OFF.
BIOS Settings
- CPU PBO Enable Auto OC.
- Memory overclocked to 3666MHz.
- BIOS version 1201.
- AMD_Chipset_Drivers Revision Number 1.11.22.454.
| Test platform specs |
| CPU: |
AMD Ryzen9 3950X |
| MB: |
ASUS ROG Crosshair VIII HERO |
| Graphics card: |
ASUS ROG Strix RX5700XT |
| RAM: |
G.SKILL Flare X DDR4-3200 CL14 8GB*2 |
| Storage: |
TeamGroup CARDEA ZERO Z440 M.2 PCIe SSD 1TB |
| Power supply: |
FSP Hydro G PRO 1000W |
| Cooler: |
Alphacool Eisbaer 360 |
CPU-Z Bench
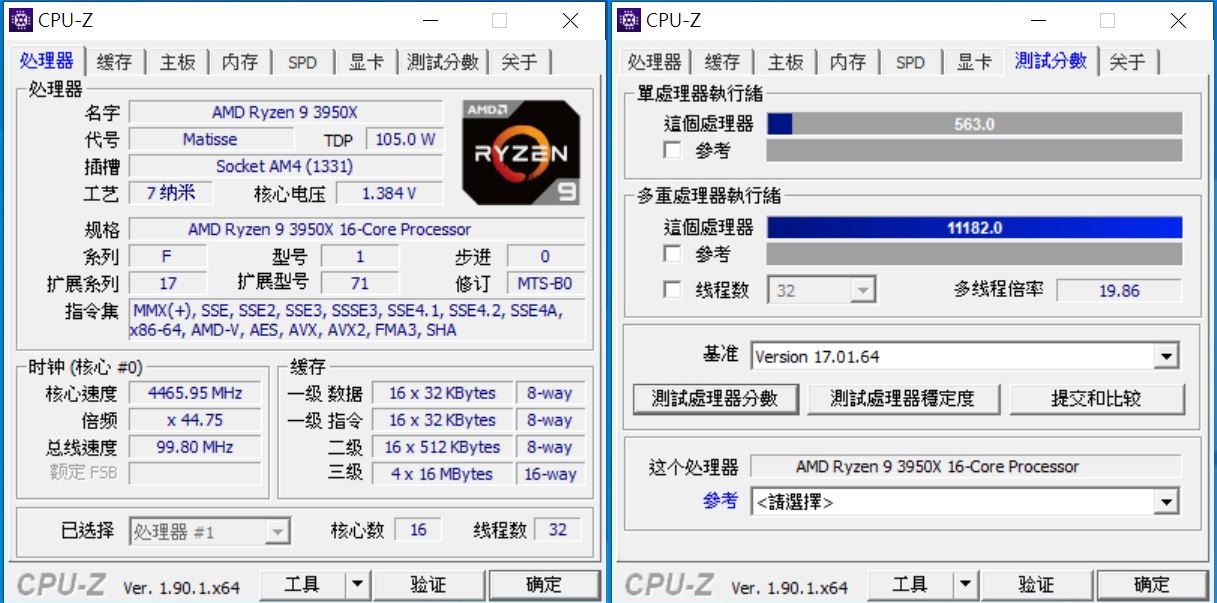
▲Single Core:563, Multi Core:11182.
Cinebench
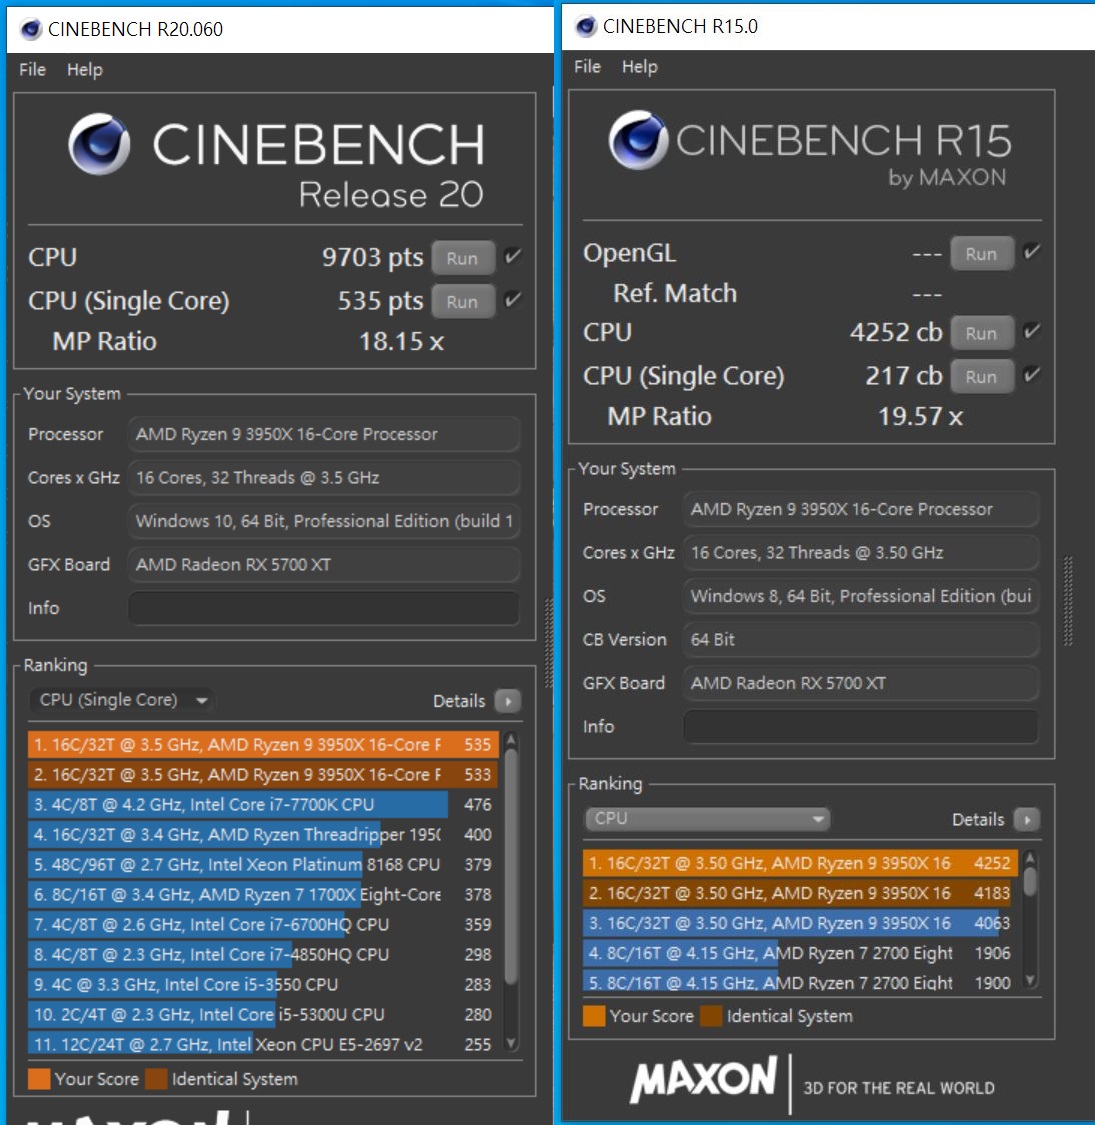
▲Cinebench R20 Benchmark,Single Core / Multi Core:535 / 9703。
Cinebench R15 Benchmark,Single Core / Multi Core:217 / 4252。
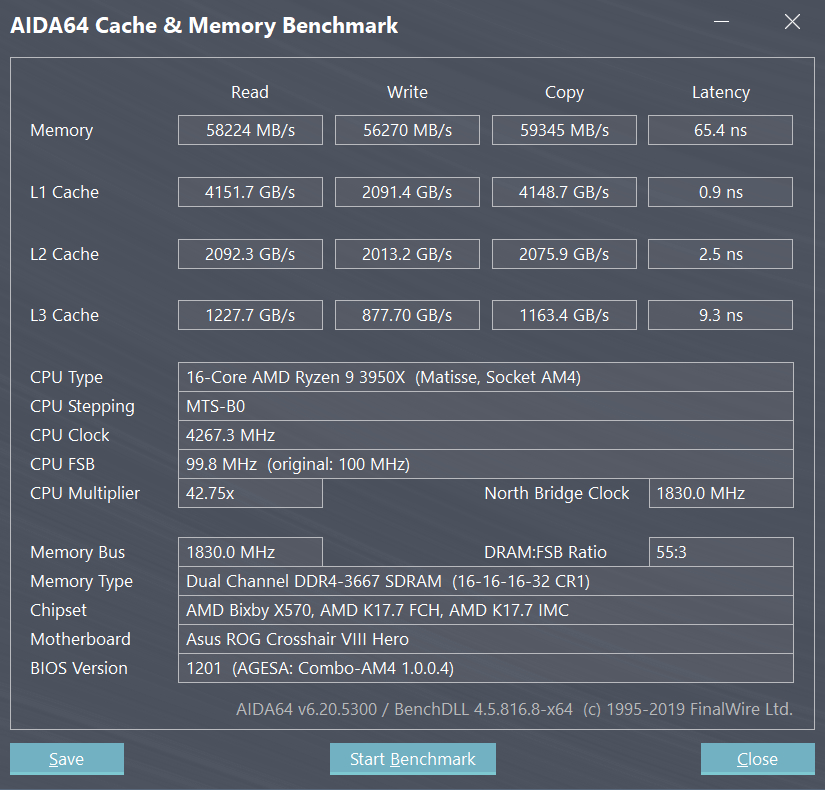
AIDA 64 Cache & Memory Benchmark
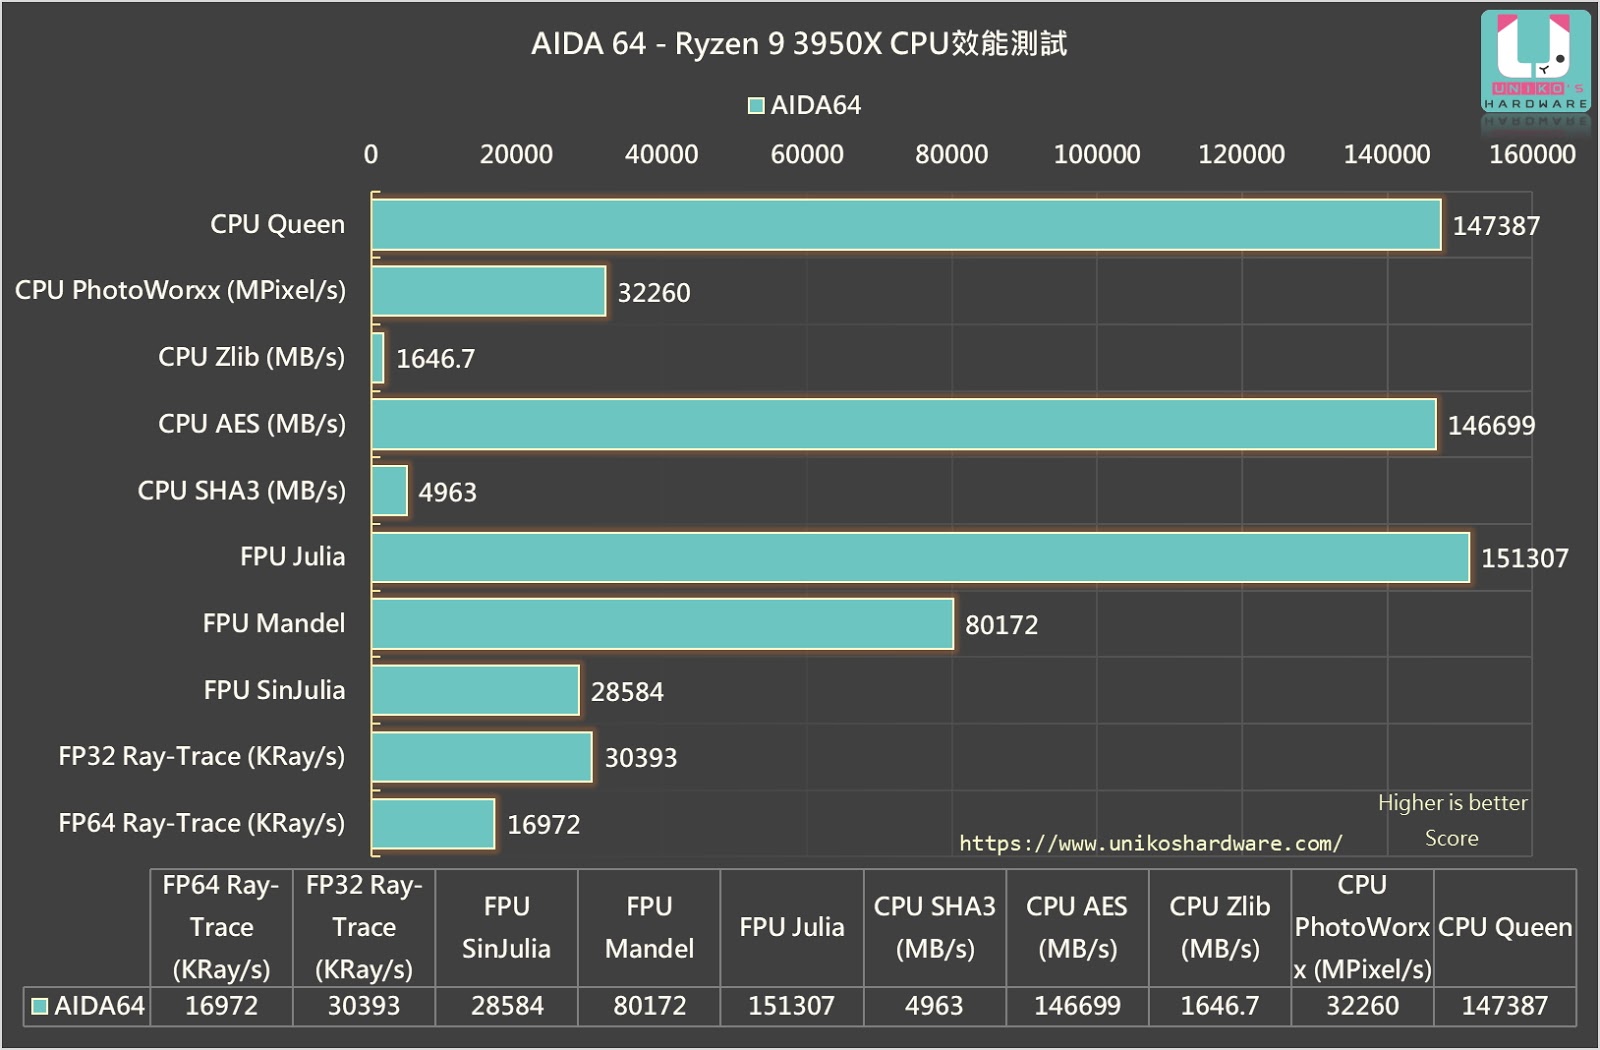
AIDA 64 CPU performance testing
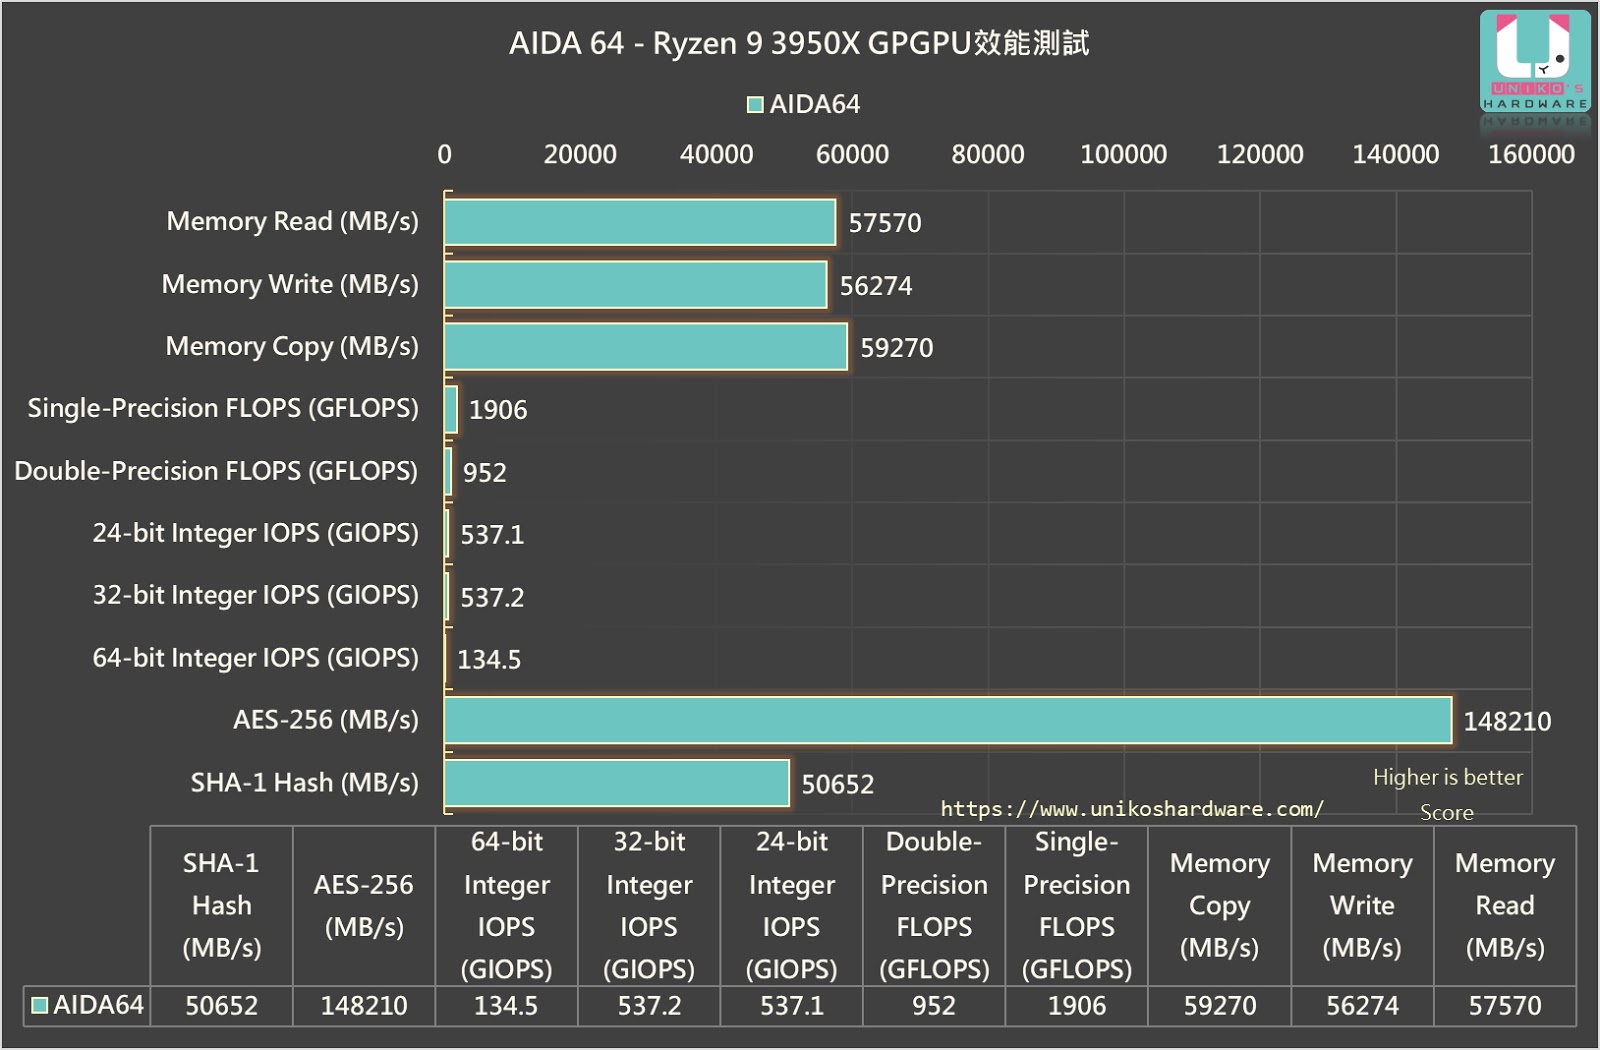
AIDA64 GPGPU performance testing
PCMark 10 Extended
▲Overall score: 9413.
3DMARK Fire Strike
▲Total score: 23532, Graphics score: 25675, Physics score: 32375, Combined score: 11561.
3DMARK Fire Strike Extreme
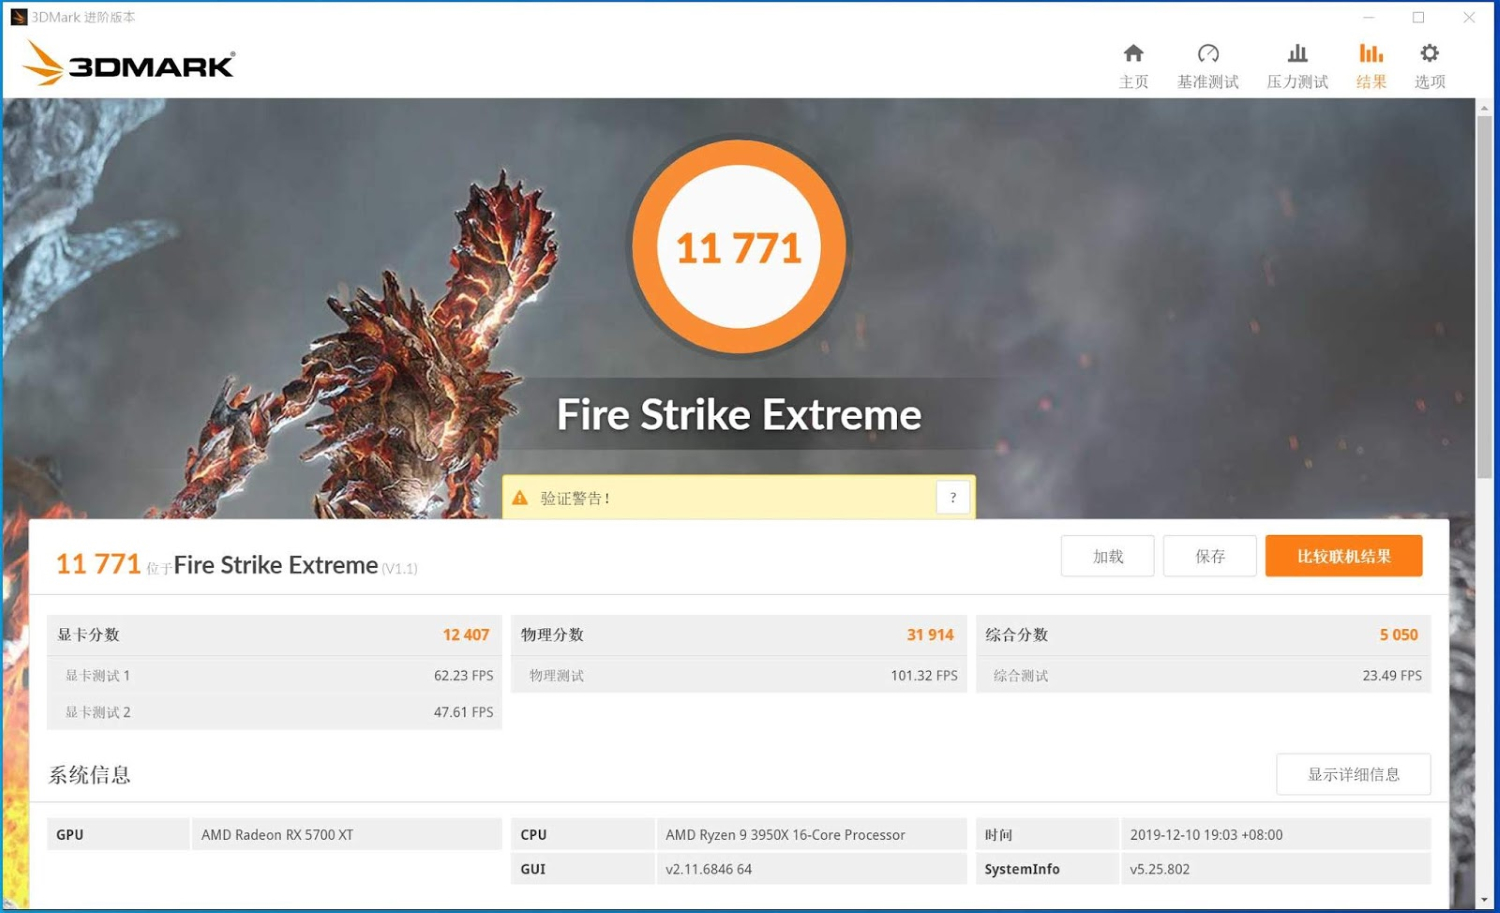
▲Total score: 11771, GPU score: 12407, Physics score 31914, Combined score: 5050.
3DMARK Fire Strike Ultra
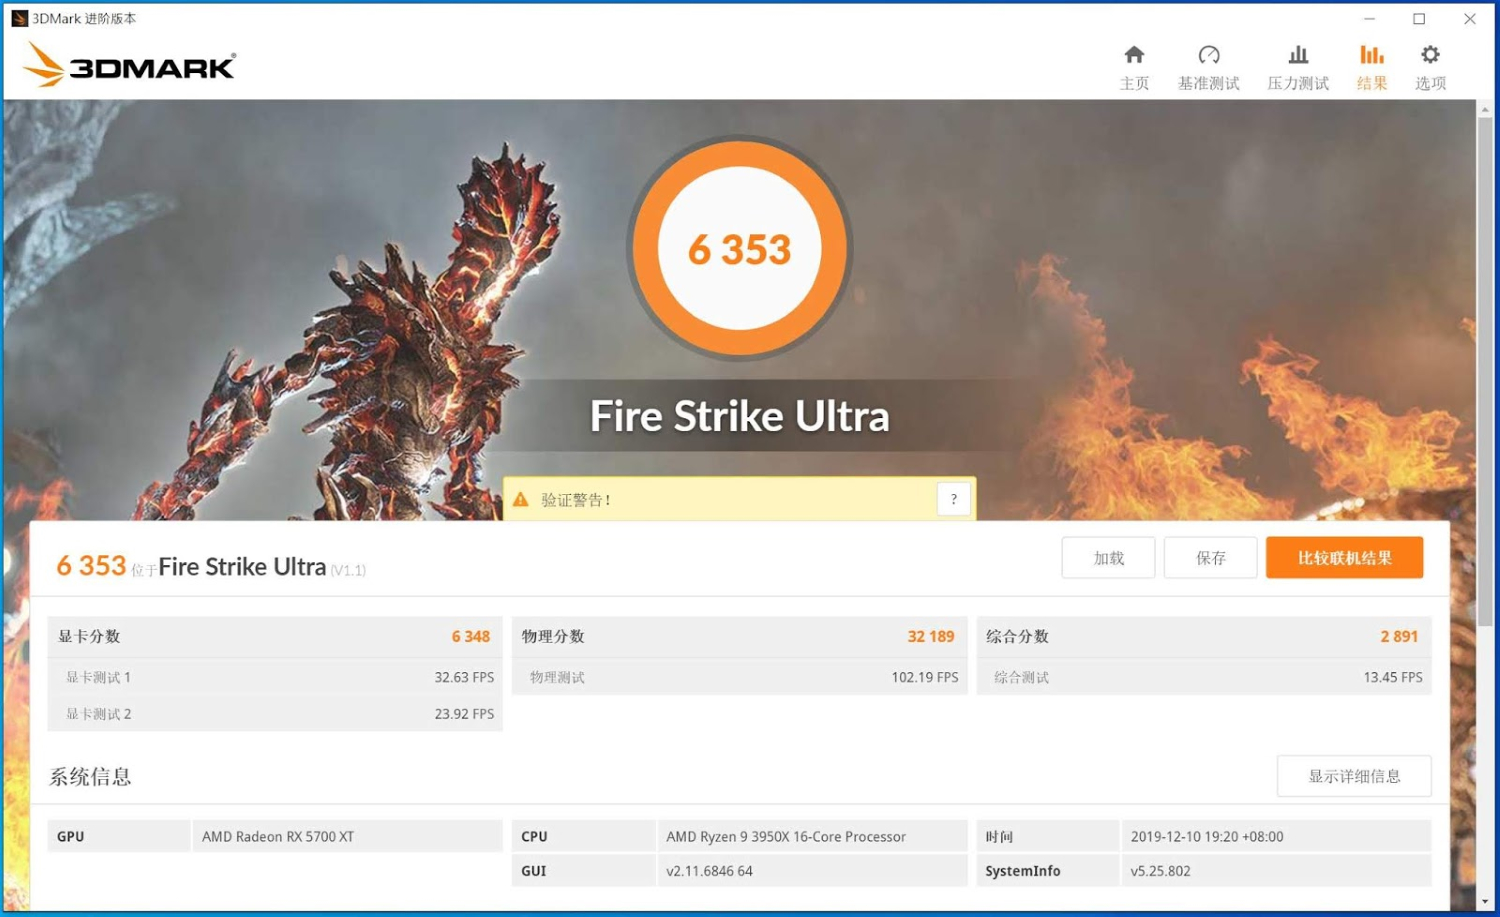
▲Total score 6353, Graphic score 6348, Physics score 32189, Combined score 2891.
3DMARK Time Spy
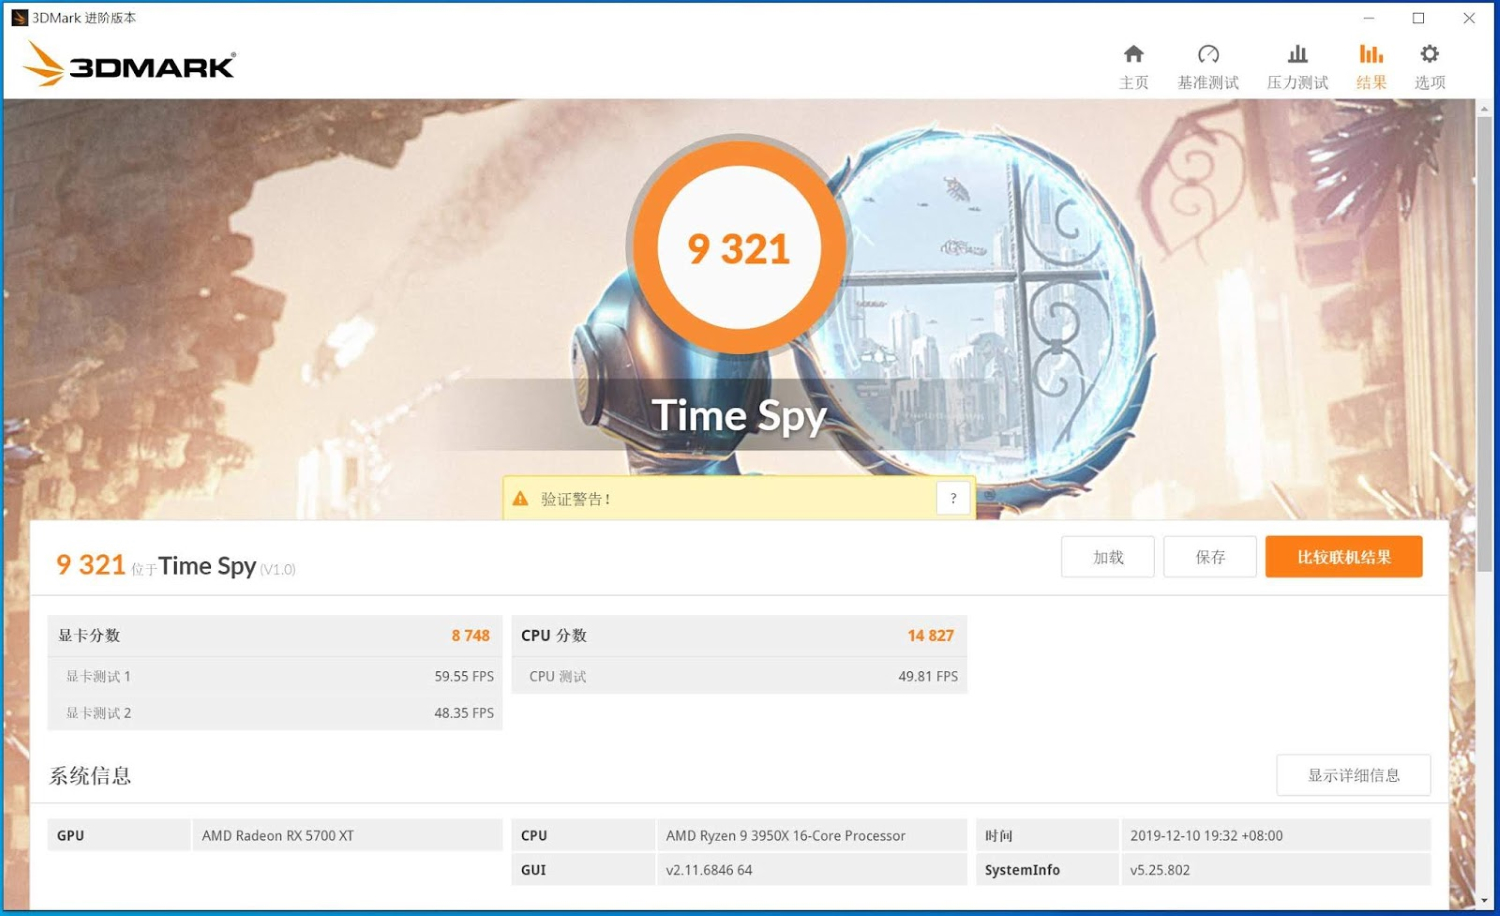
▲Total score 9321, Graphics score 8748, CPU score 14827.
3DMARK Time Spy Extreme
▲Total score 4260, Graphics score 3895, CPU score 9090.
Time Spy Extreme SIMD CPU performance testing
▲CPU instructions set to auto score: 9090.
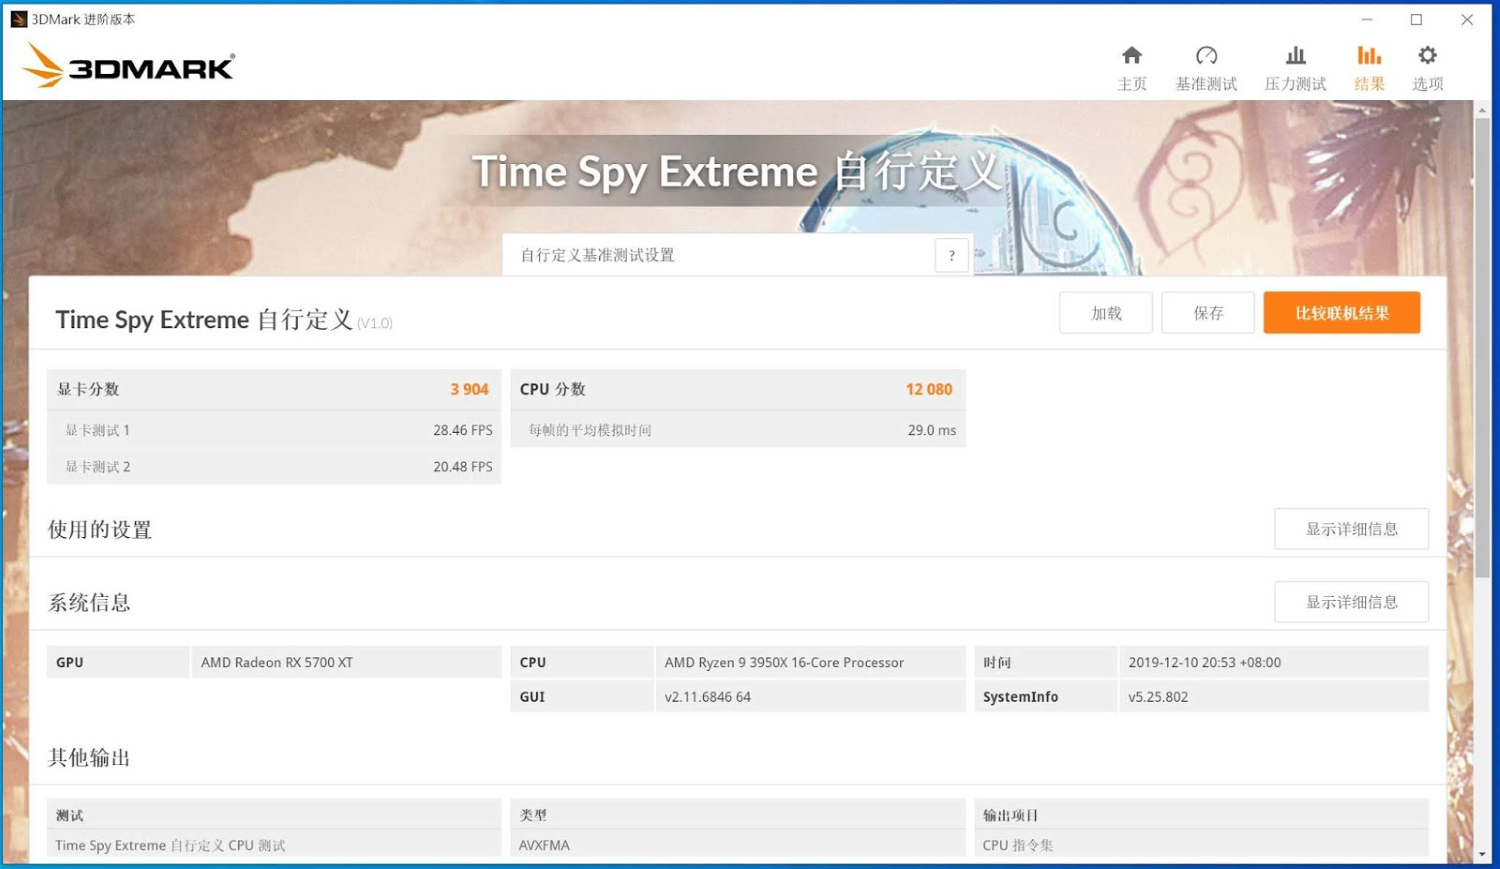
▲CPU instructions set to AVXFMA score: 12080.
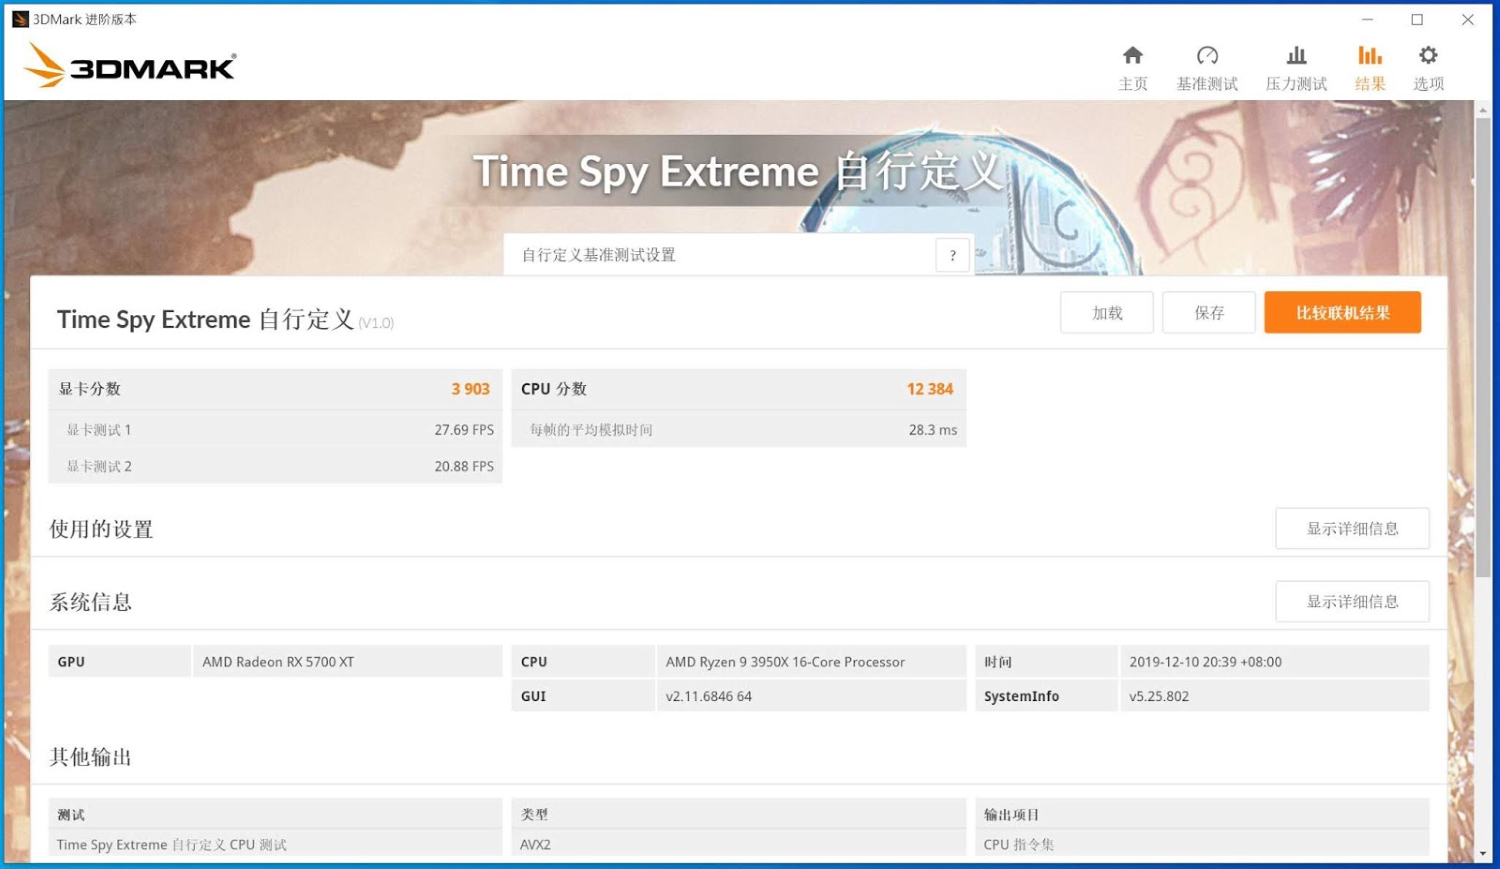
▲CPU instructions set to AVX2 score: 12384.Overall, Zen2 performance is much better than its predecessor, because of the improvement made to SIMD.
Video codec transcoding related testing
X264 FHD Benchmark
▲The Ryzen 9 3950X scores 74.1 FPS.
HWBOT x265 benchmark (1080P)
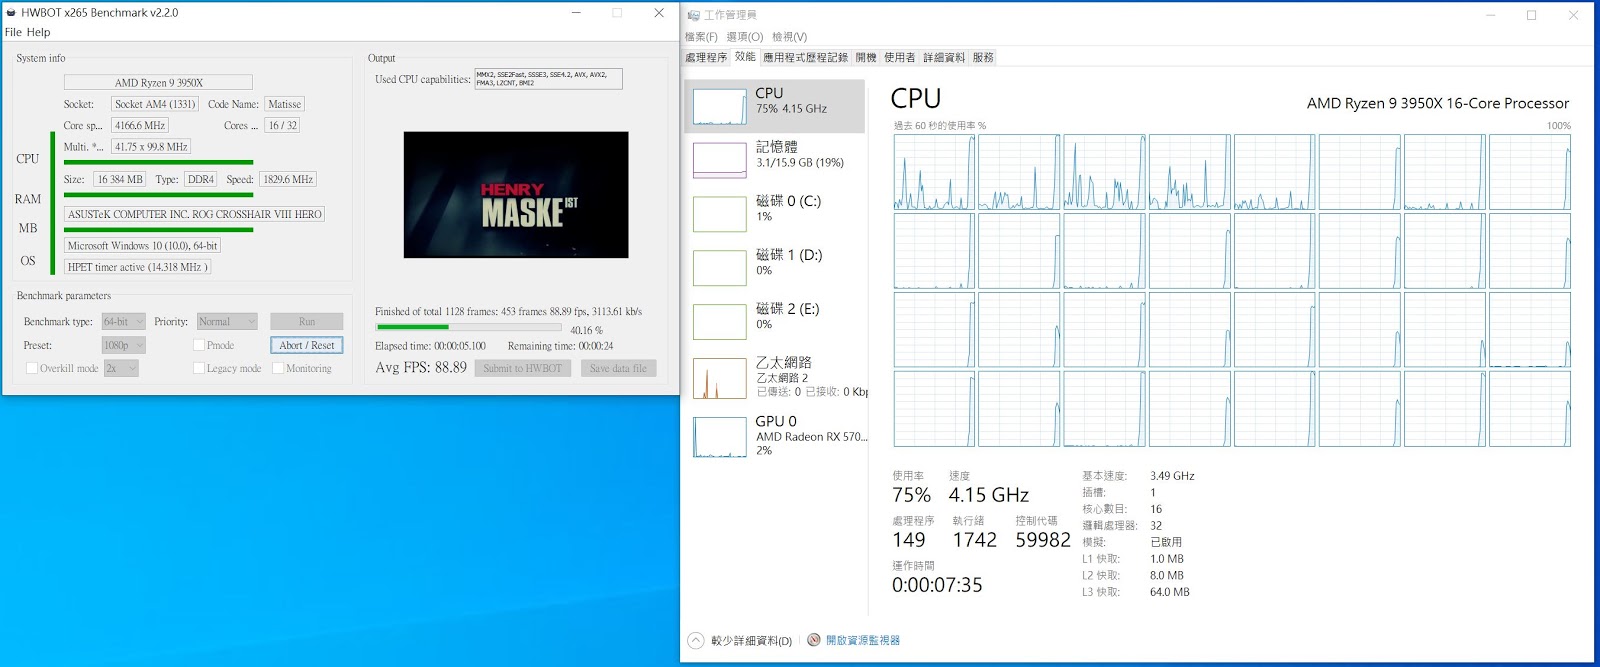
▲Here’s the R9 3950X core utilization when running the HWBOT x265 benchmark at 1080P.
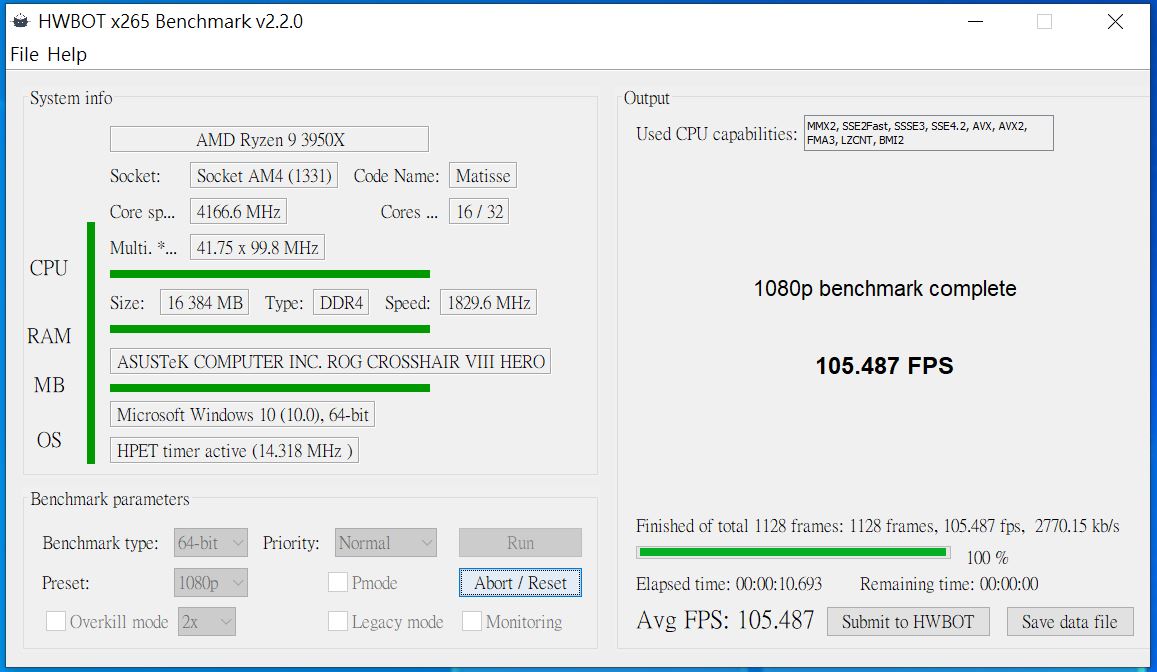
▲We get an average of 105.487 FPS encoded.
HWBOT x265 benchmark (4K)
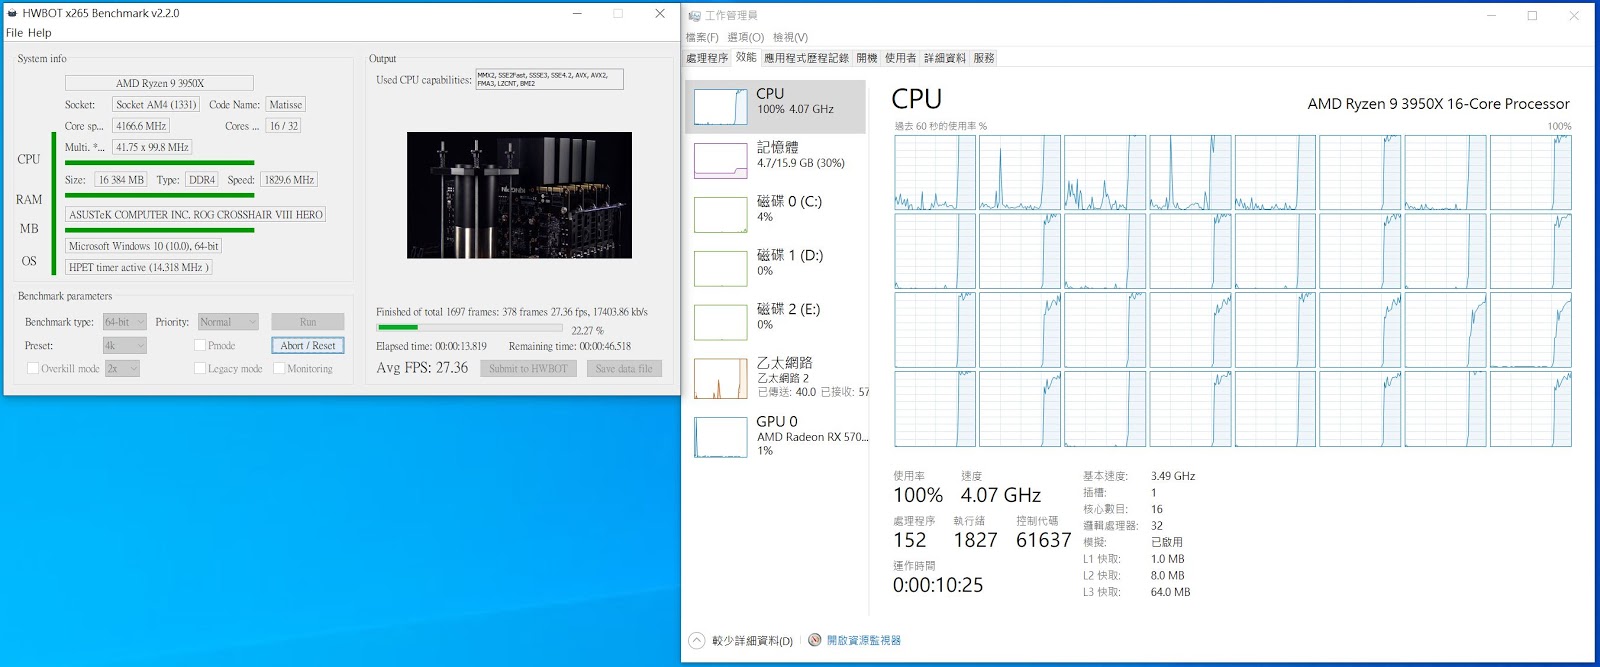
▲Here’s the R9 3950X core utilization when running the HWBOT x265 benchmark at 4K.
▲We get an average of 28.562 FPS encoded.
7-Zip compression test
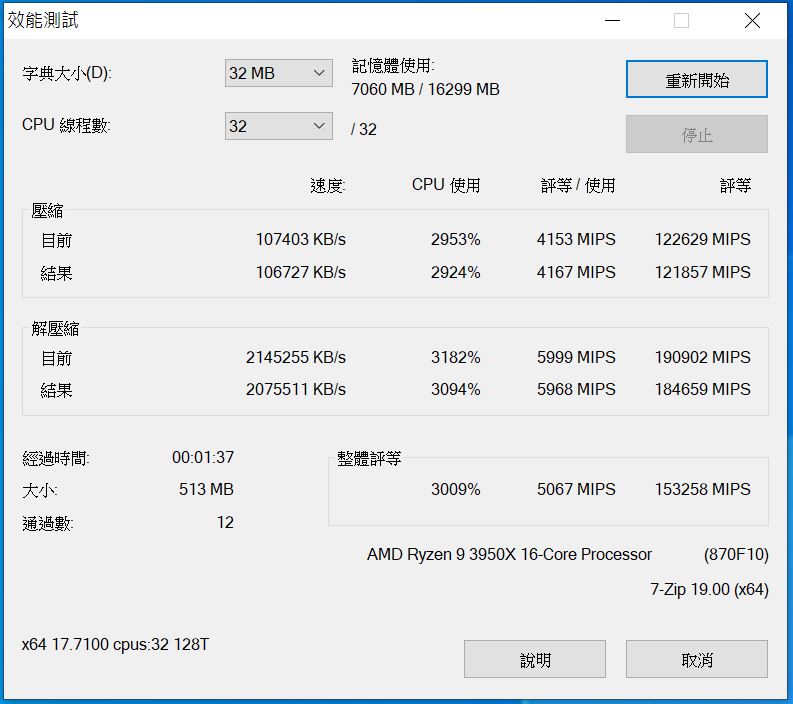
▲Compression (MIPS)121857, Decompression (MIPS)184659, Overall (MIPS)153258.
WinRAR benchmark
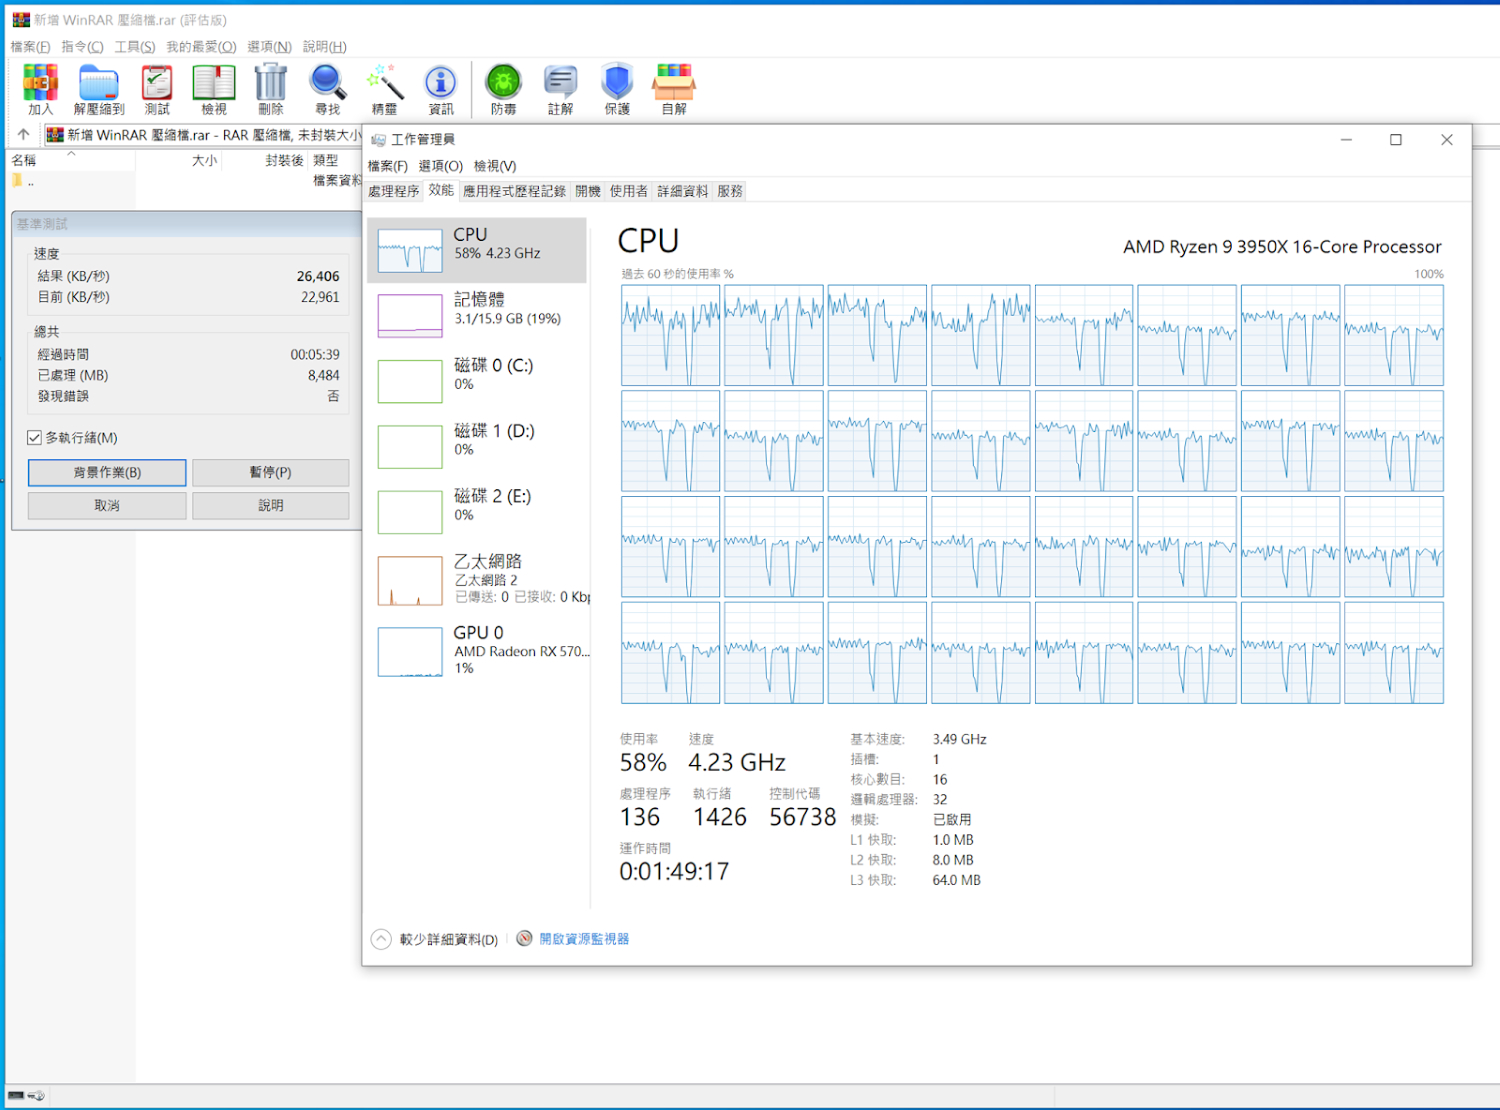
▲Here’s the 3950X core utilization when running the WinRAR benchmark. The result is 26406 KB/s.
Y-Cruncher
▲The time needed to calculate Pi is 85.117 seconds, Total time used for calculation is 91.591 seconds.
wPrime Benchmark
▲wPrime 2.10 1024M took 44.91 seconds.
Corona 1.3 Benchmark
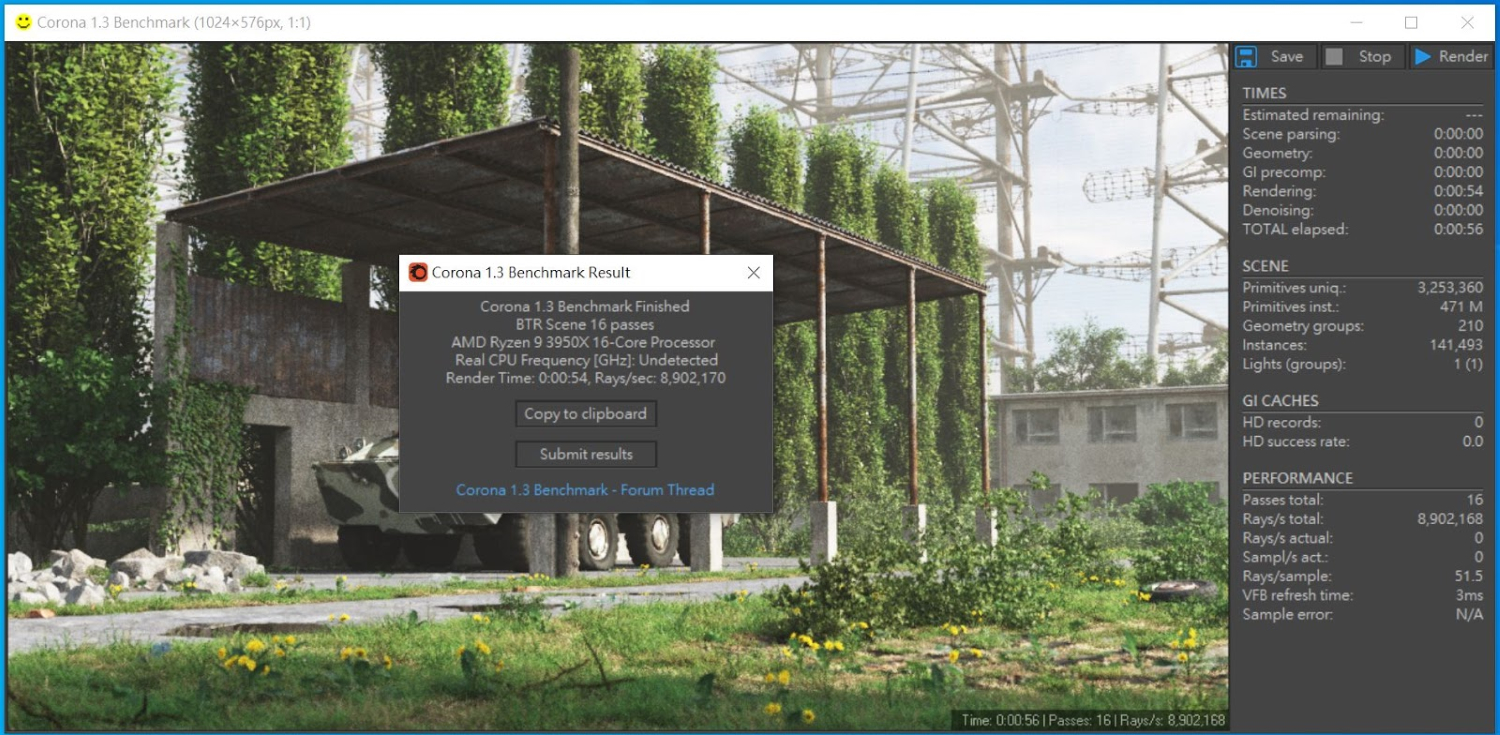
▲Corona Benchmark took 54 seconds to render.
V-Ray benchmark
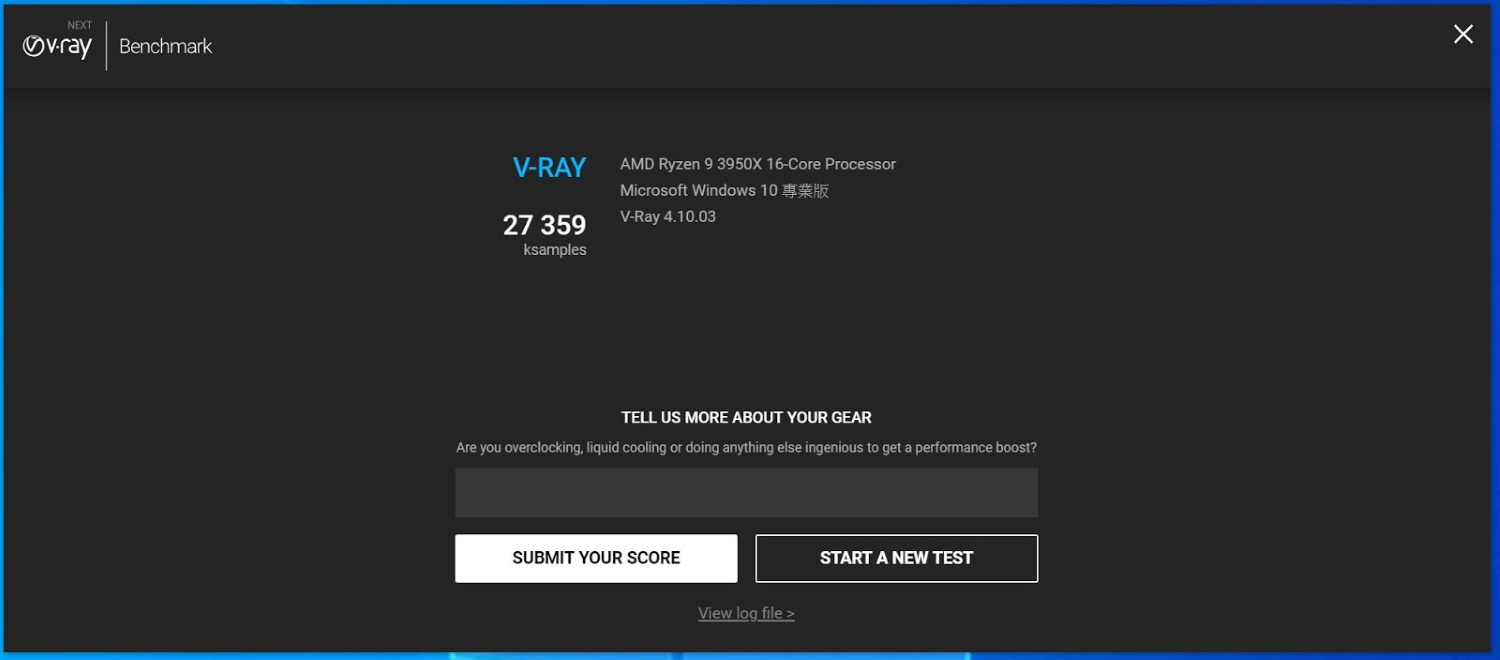
▲The R9 3950X score 27359 points.
POV-Ray Benchmark
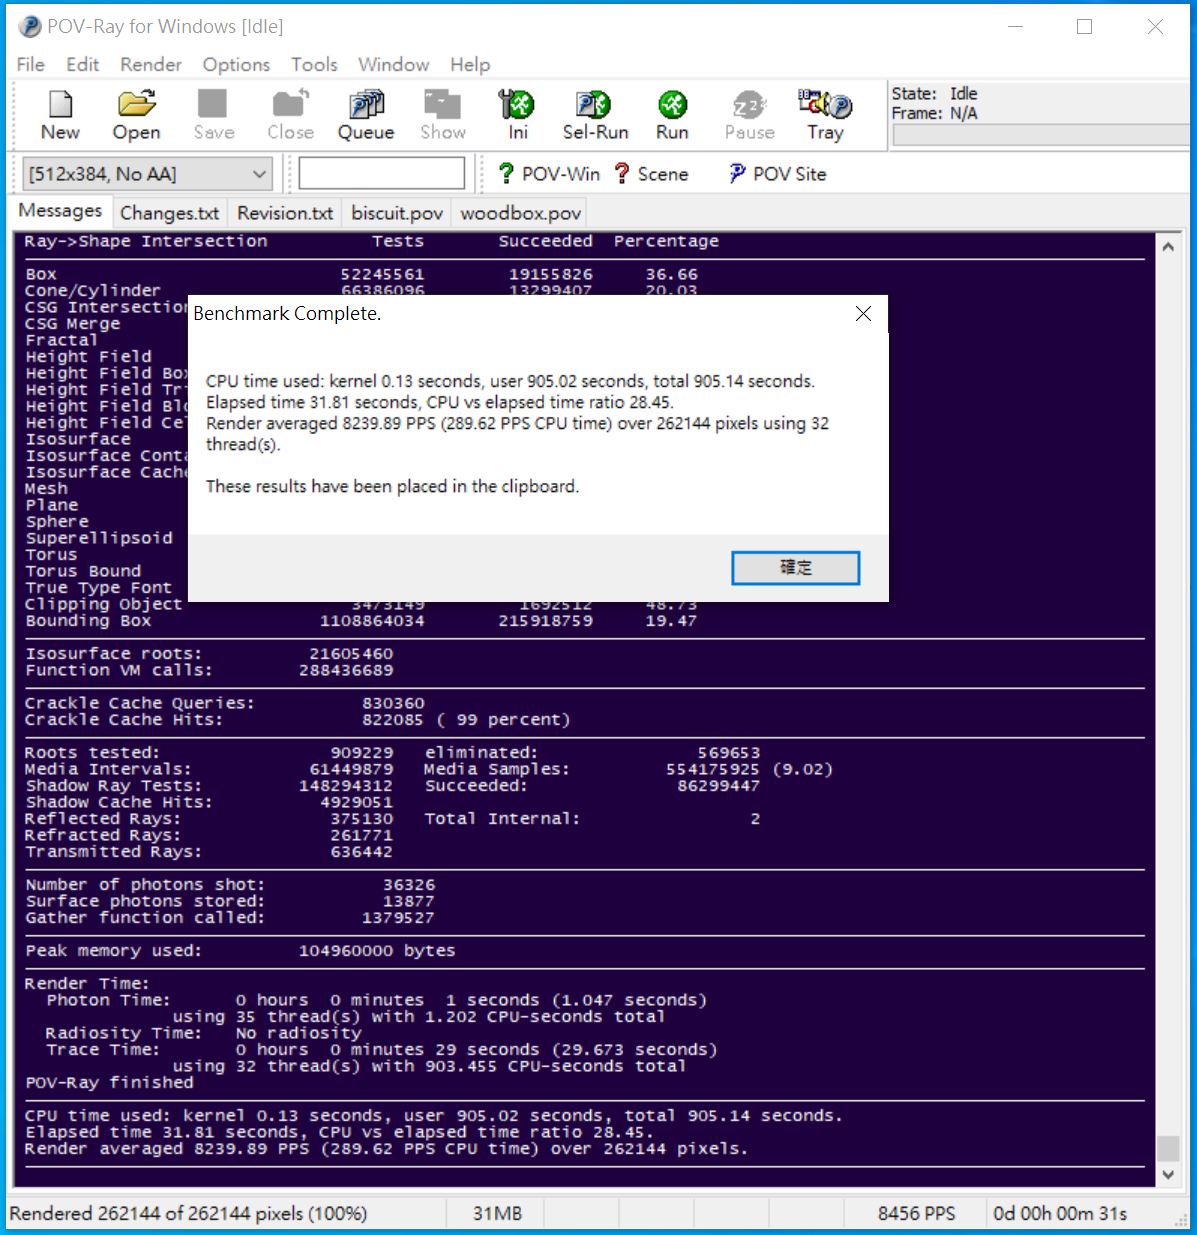
▲We get a score of 8239.89 FPS.
Temperature & power consumption testing
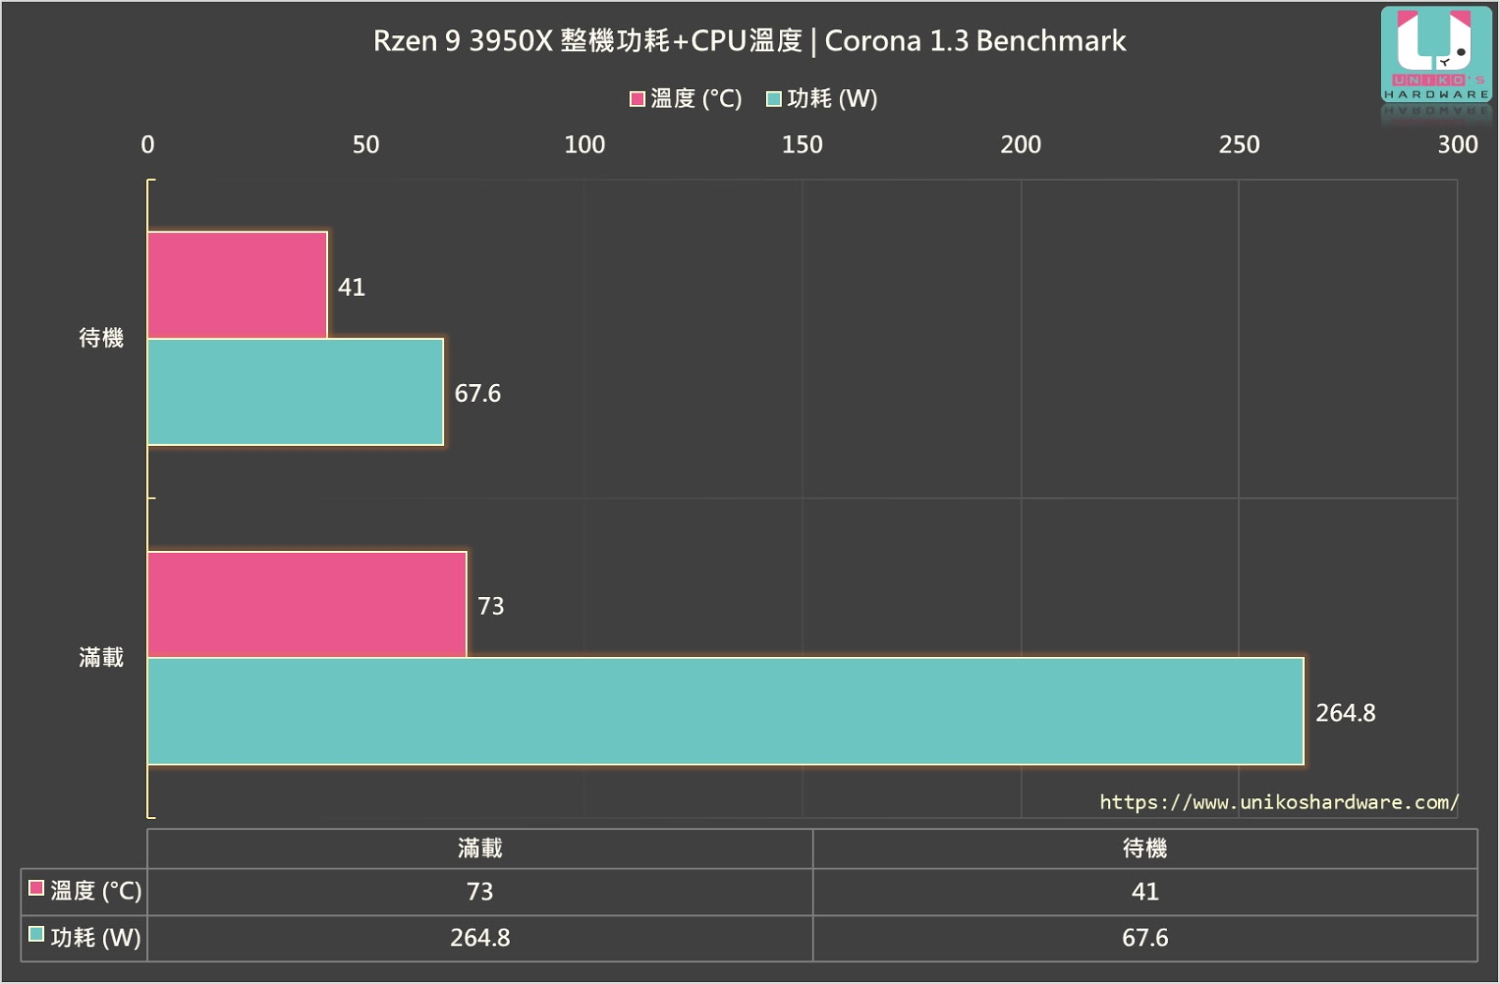
▲Here’s the R9 3950X power consumption and temperature at idle and at full load while running Corona 1.3.
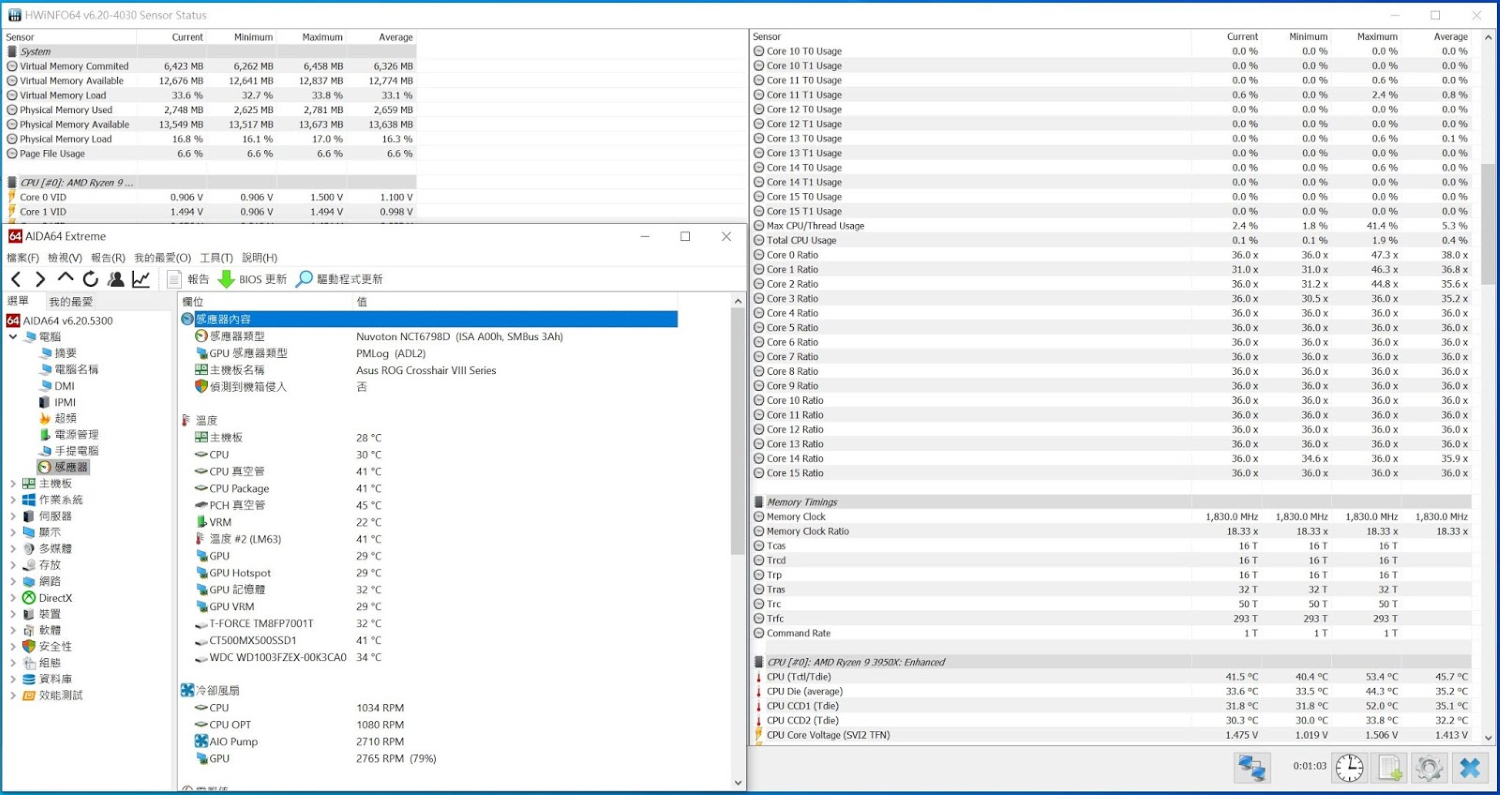
▲We have a temperature of 41 degrees while the system is idle.
AIDA64 Burn Test
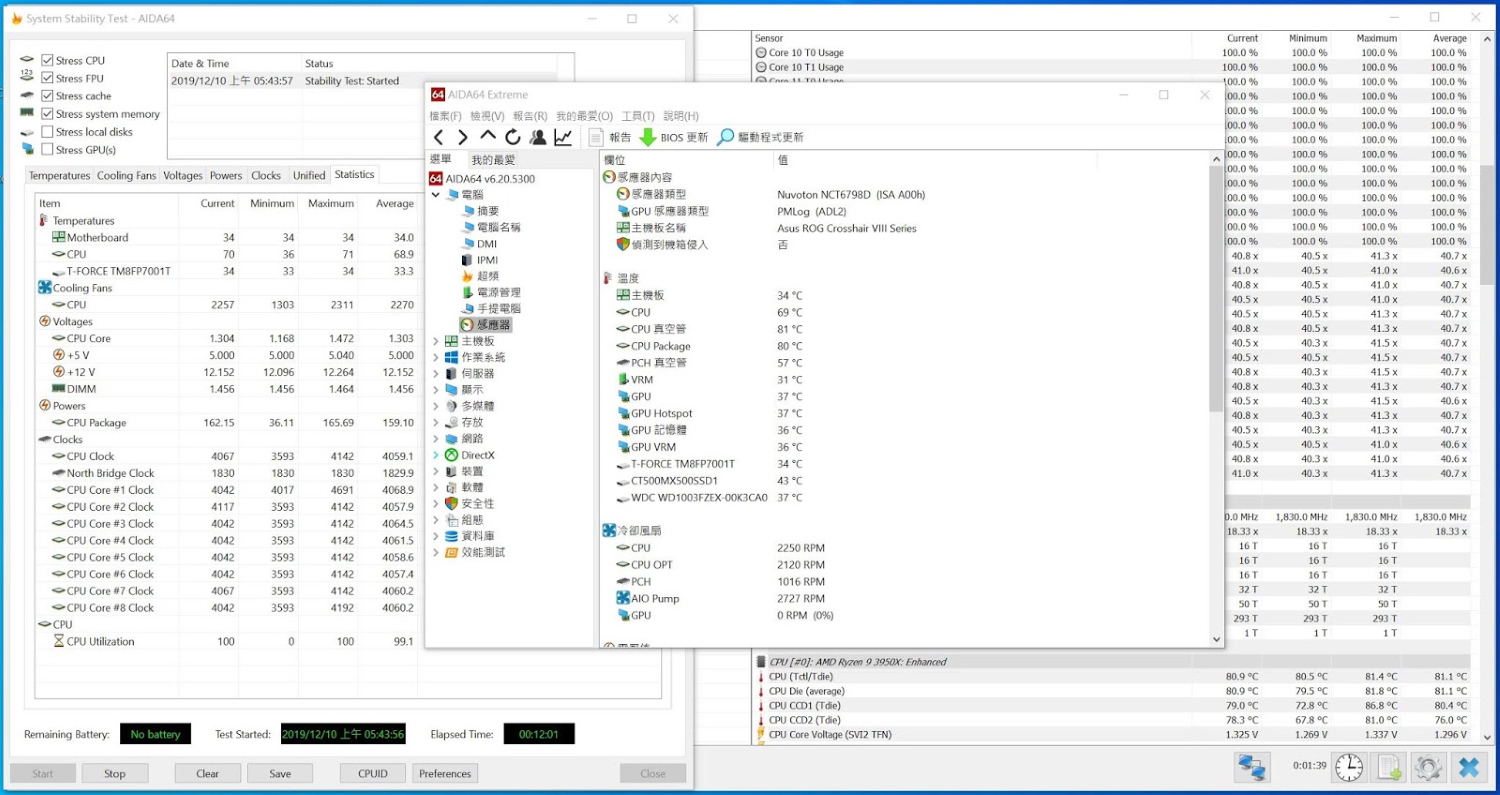
▲We get a temperature of 81 degrees Celsius during the AIDA64 burn test.
AIDA64 FPU Burn Test
▲The R9 3950X reaches 85 degrees Celsius while running the AIDA64 FPU burn test.
1080P & 1440P Gaming benchmarks
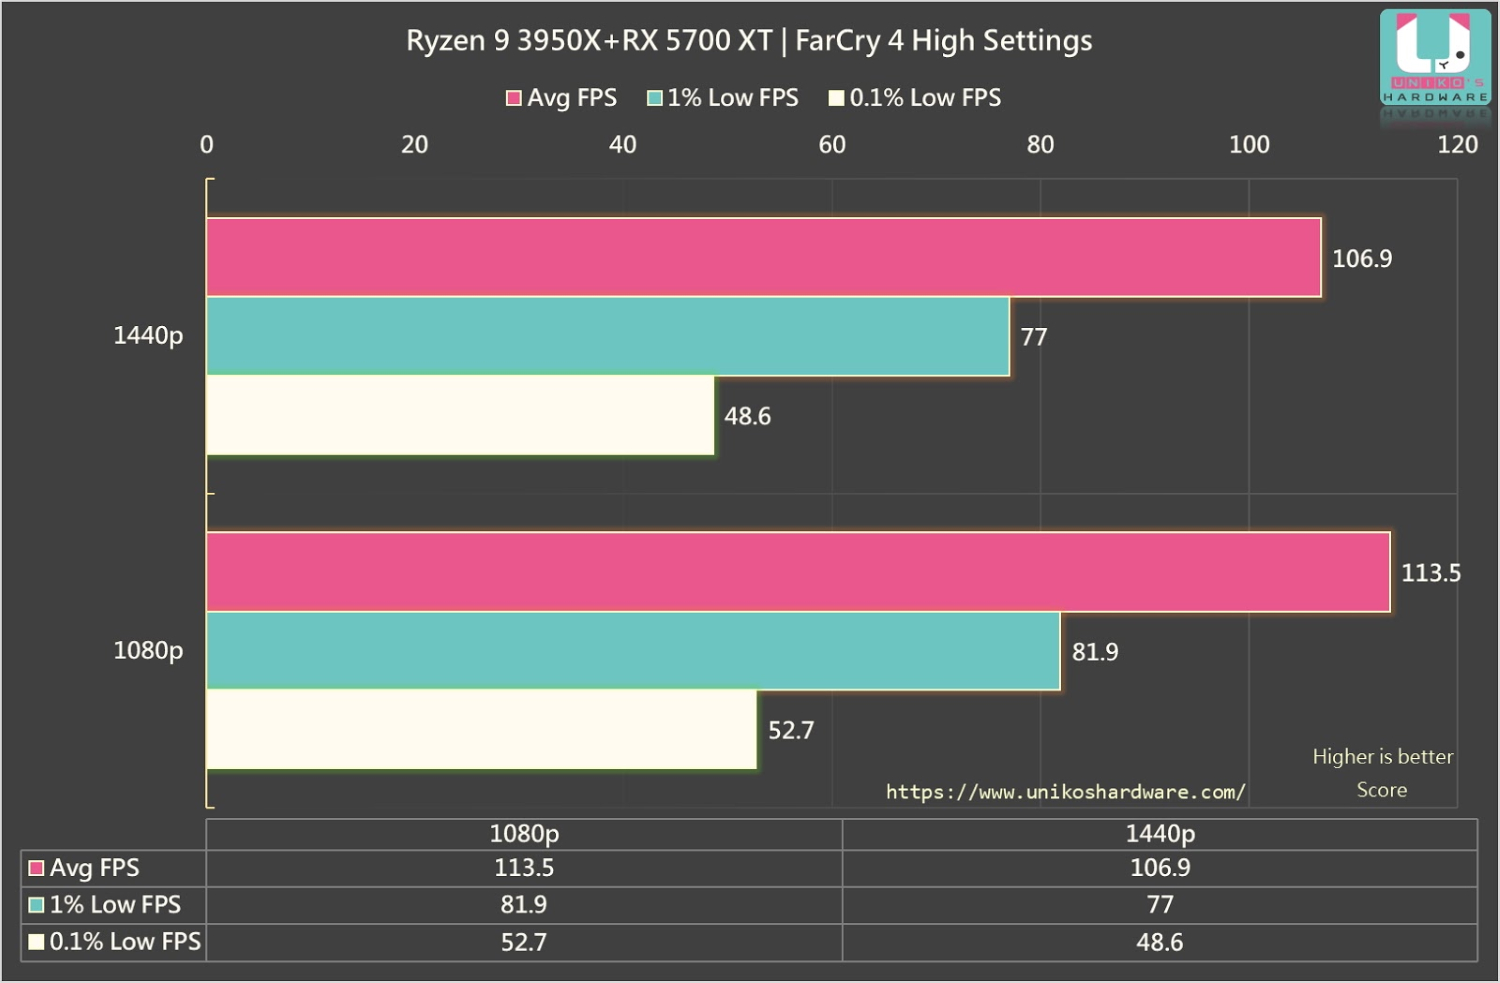
Far Cry 4
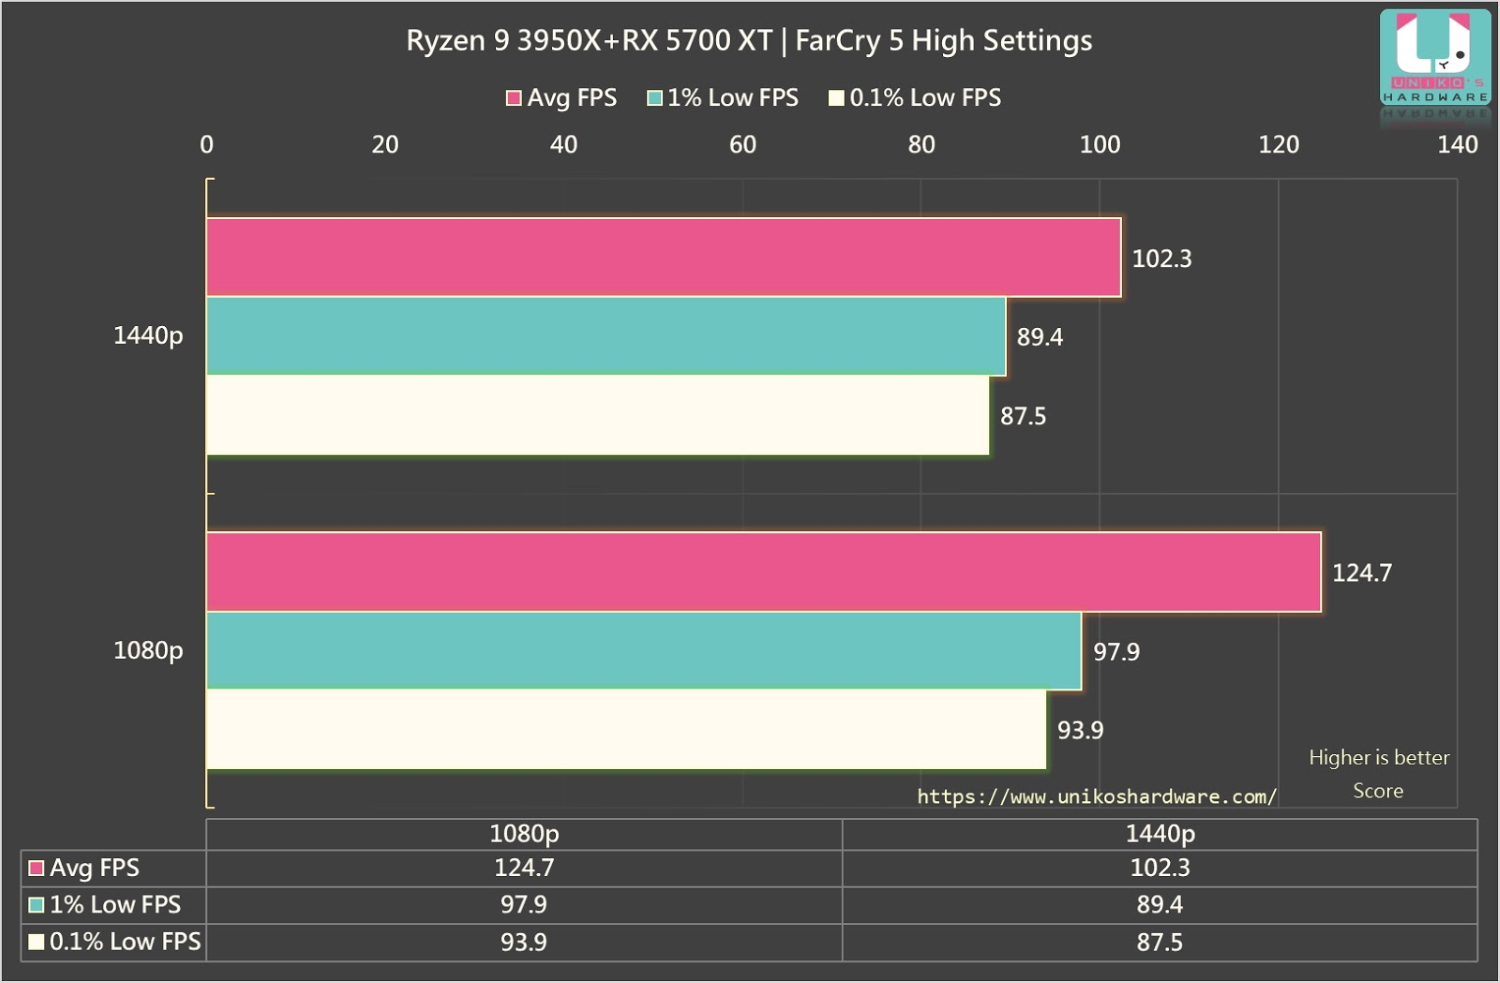
Far Cry 5
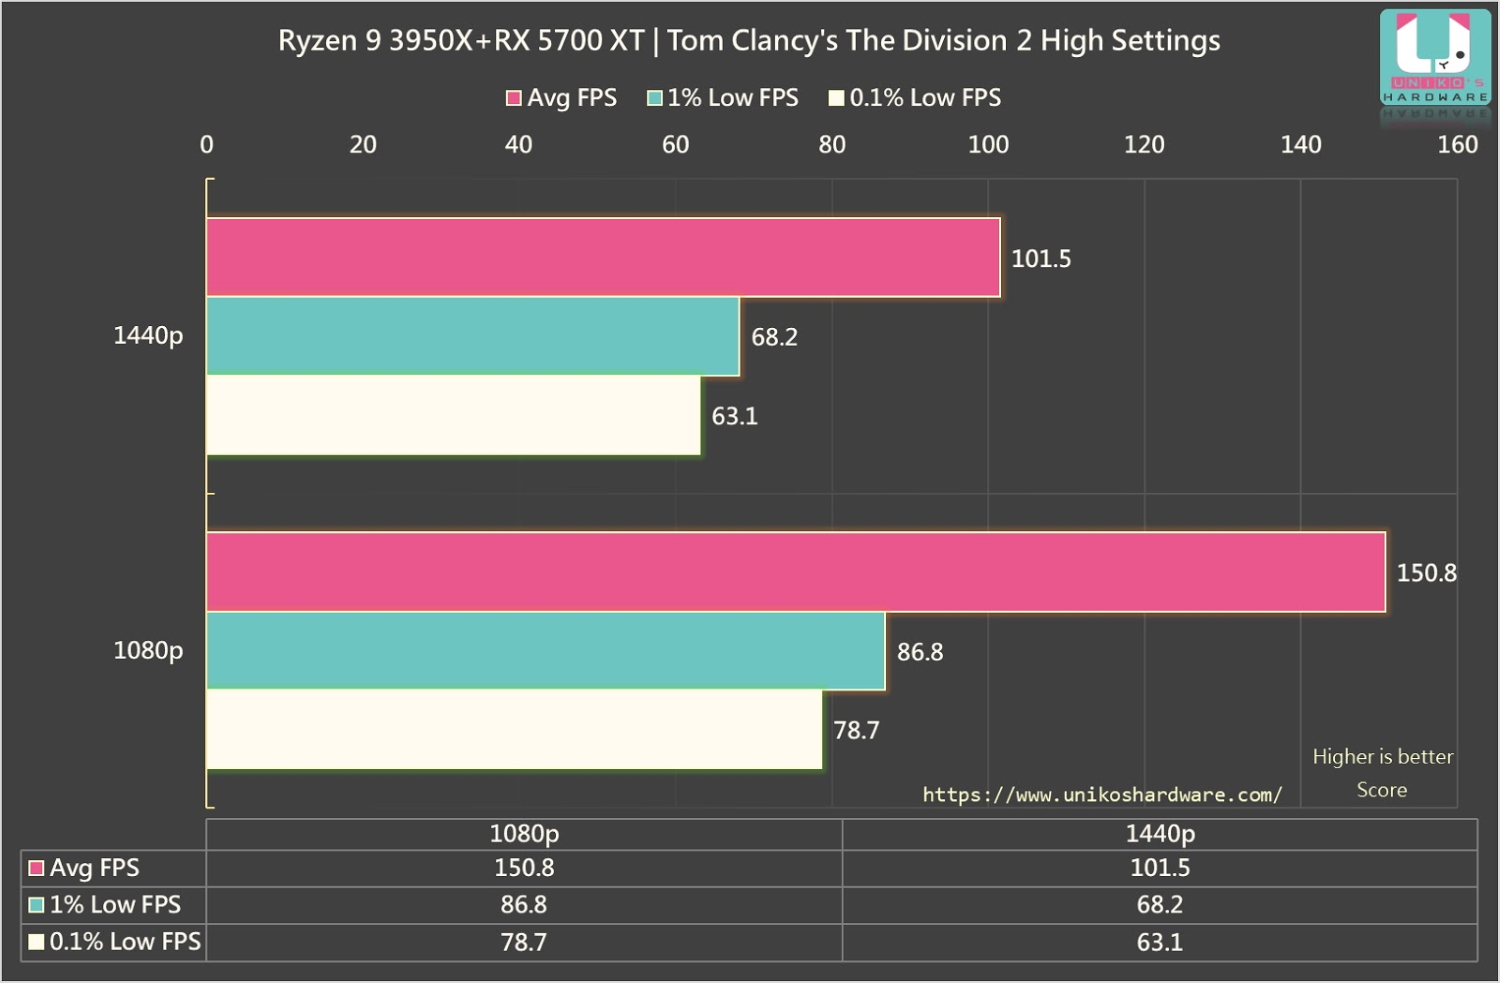
Tom Clancy’s The Division 2
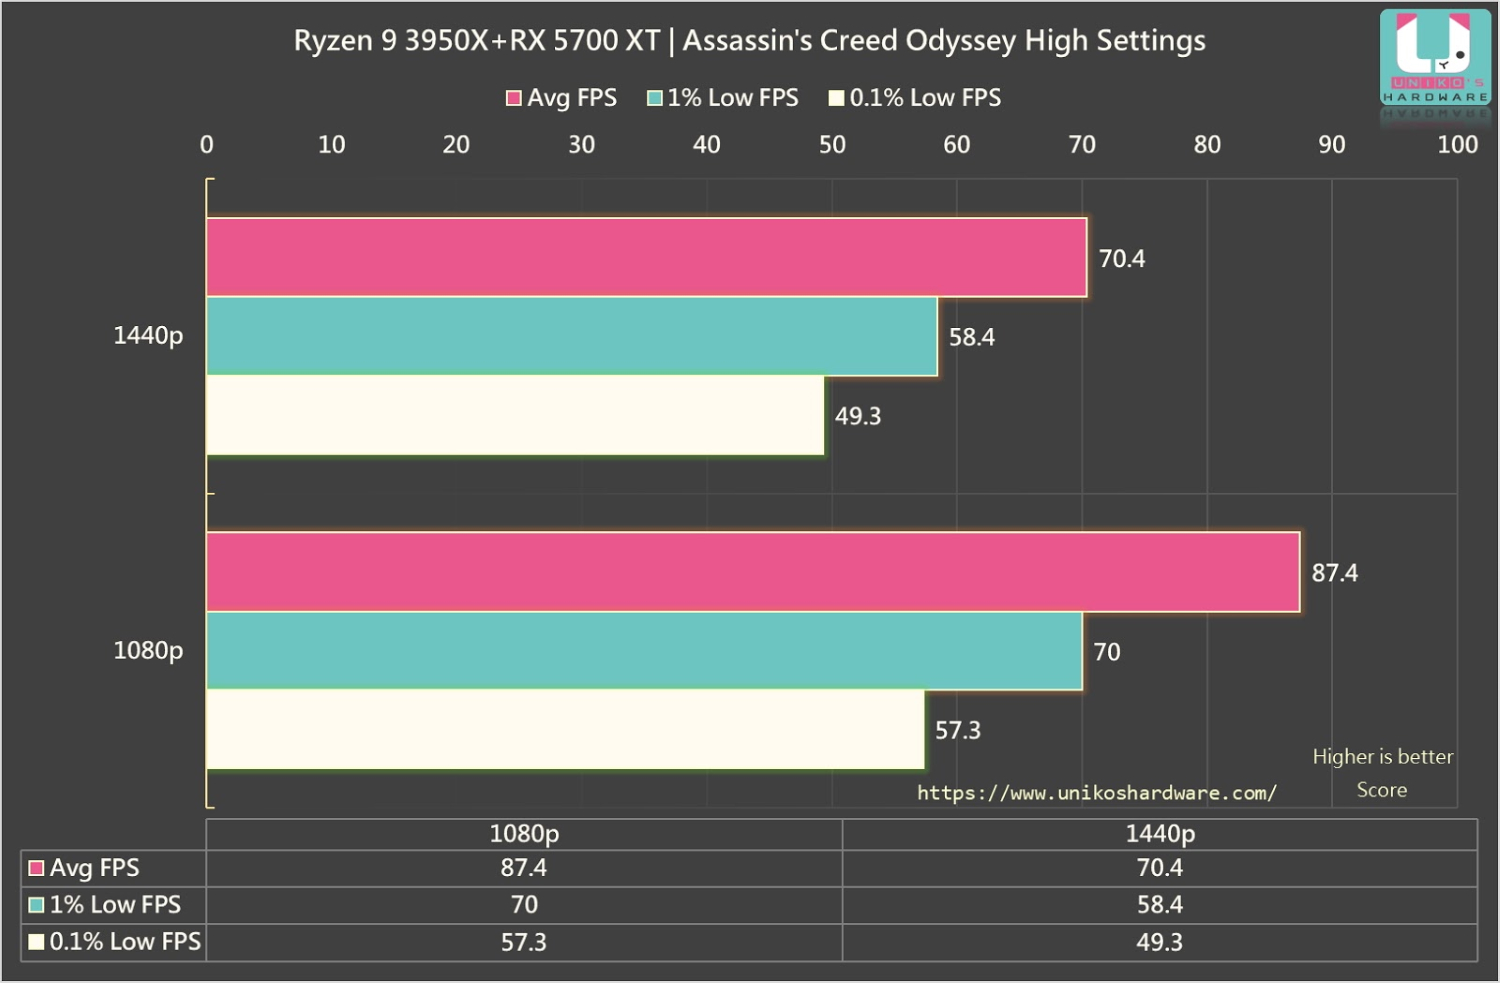
Assasin’s Creed Odyssey
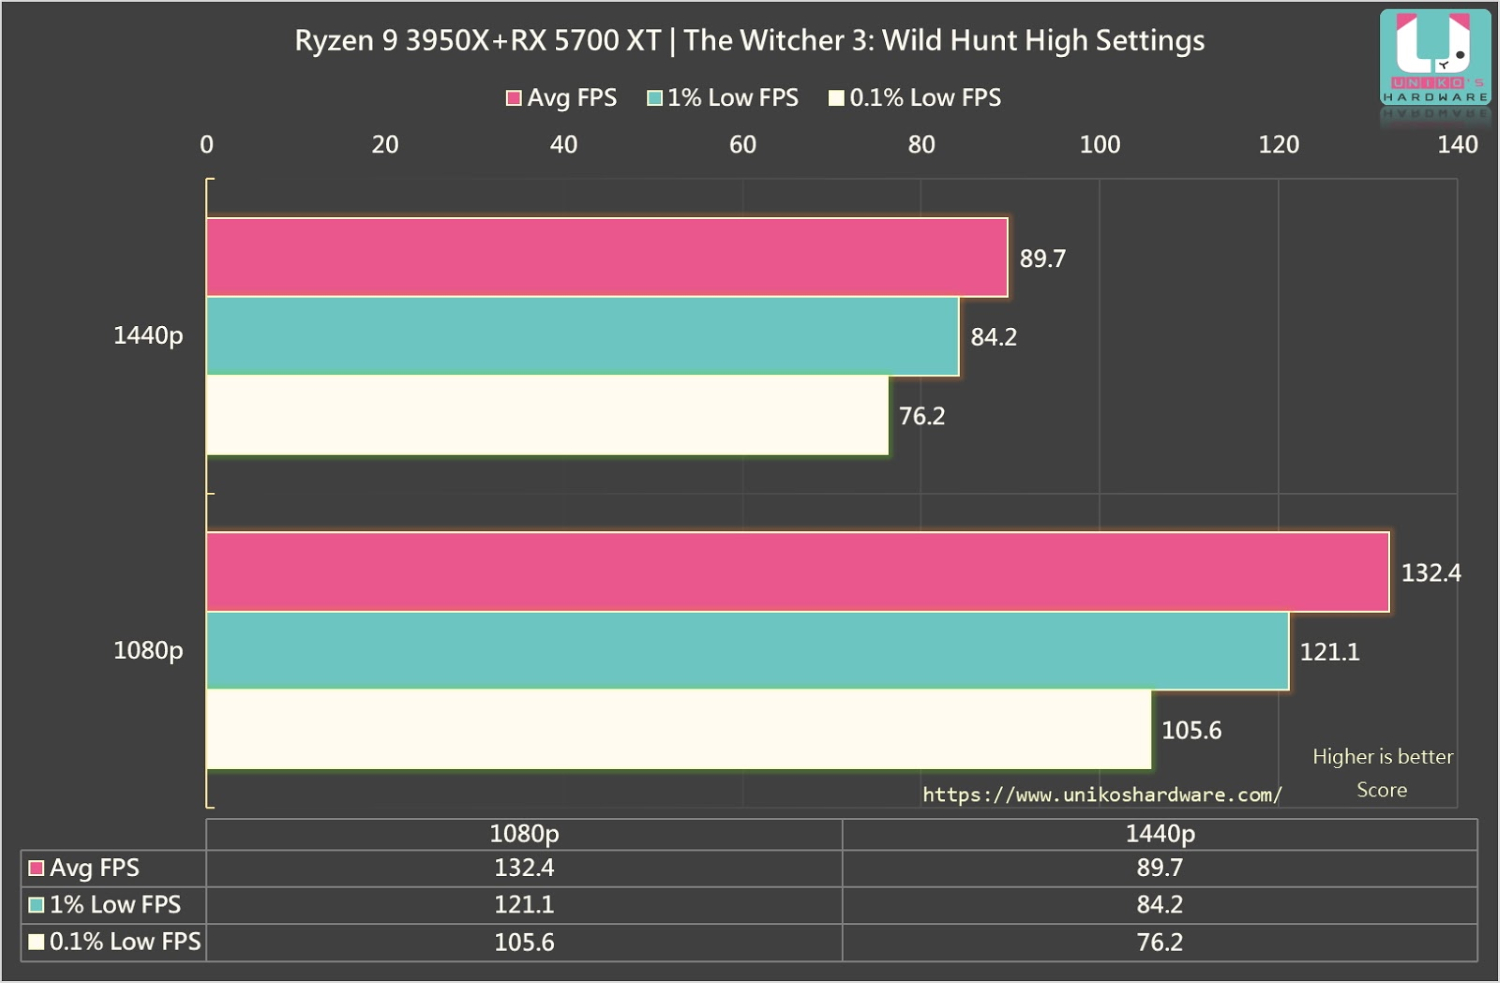
Witcher 3: Wild Hunt
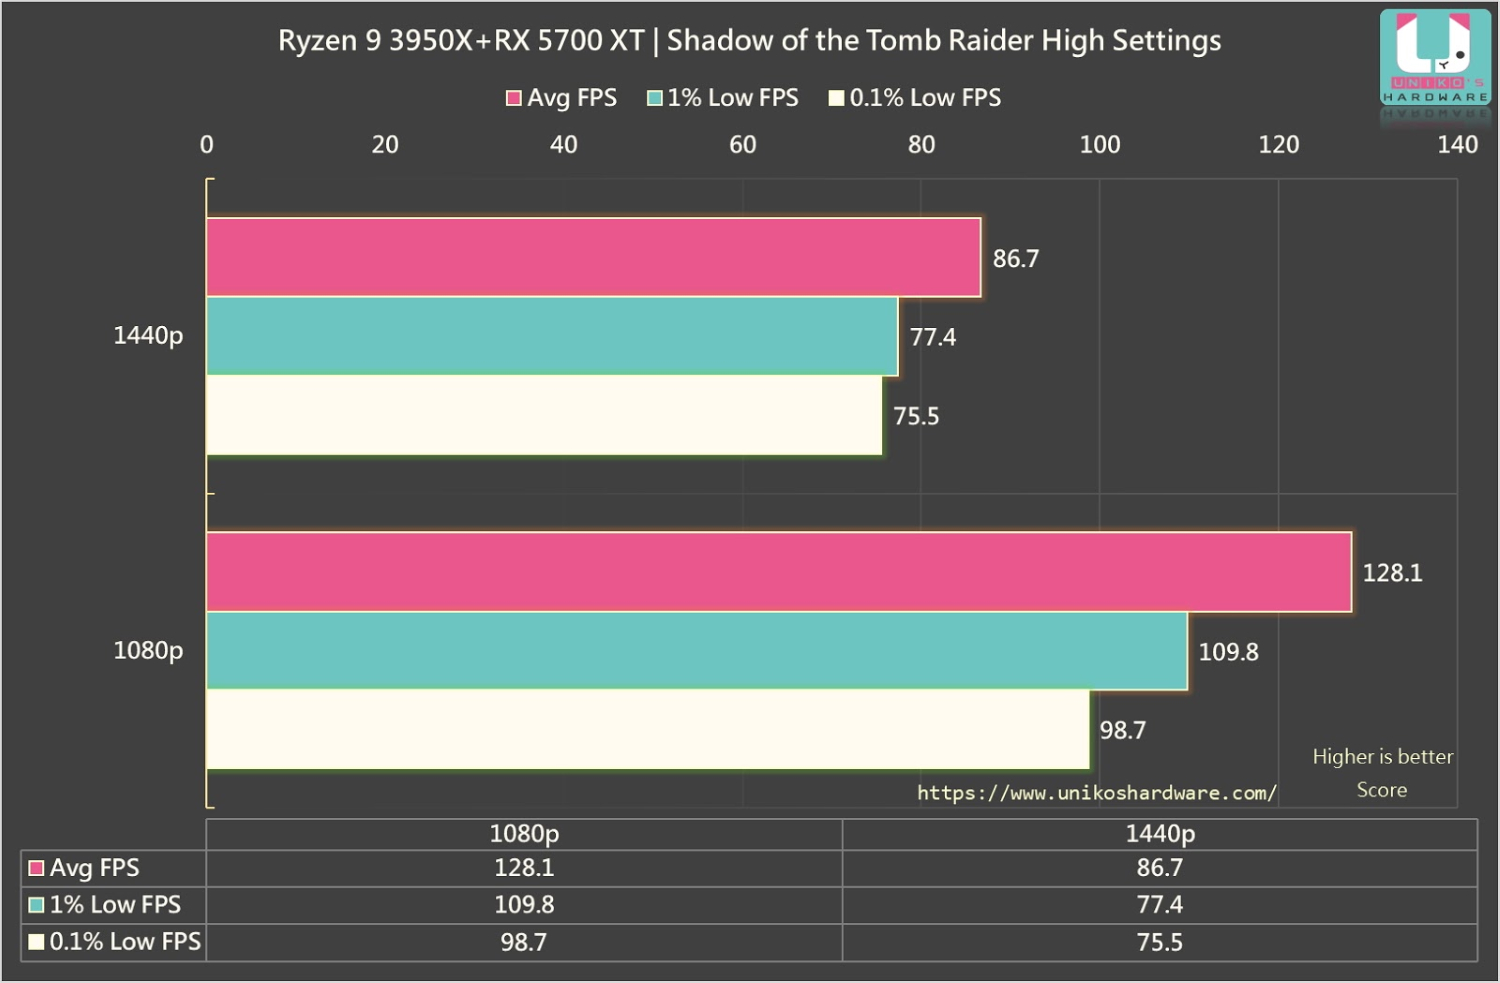
Shadow of the Tomb Raider
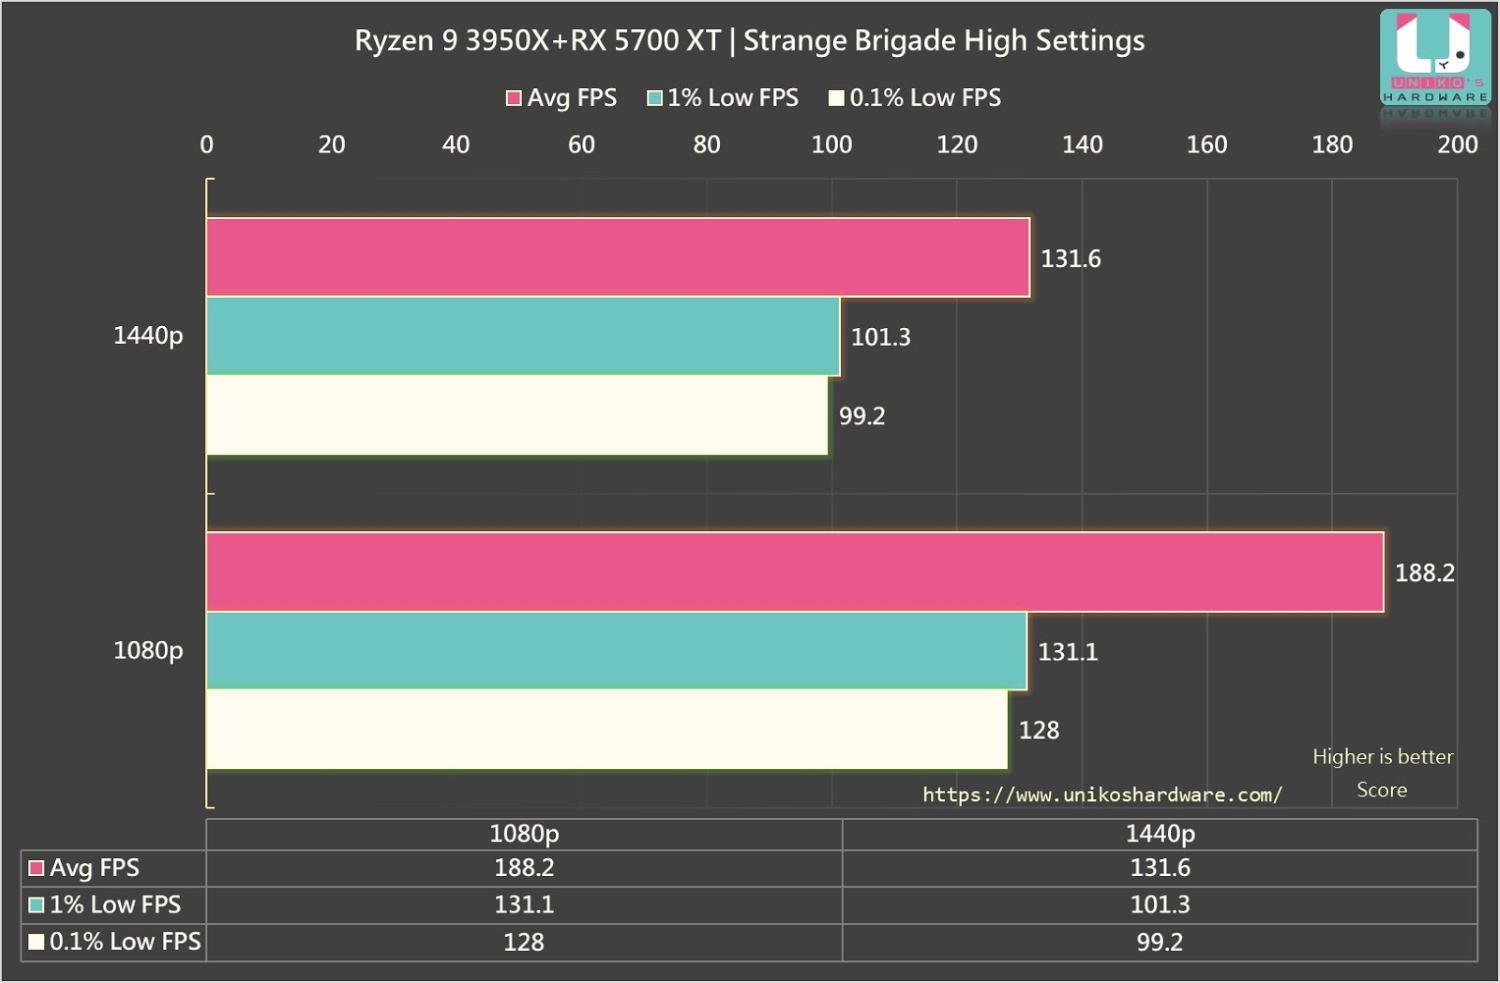
Strange Brigade
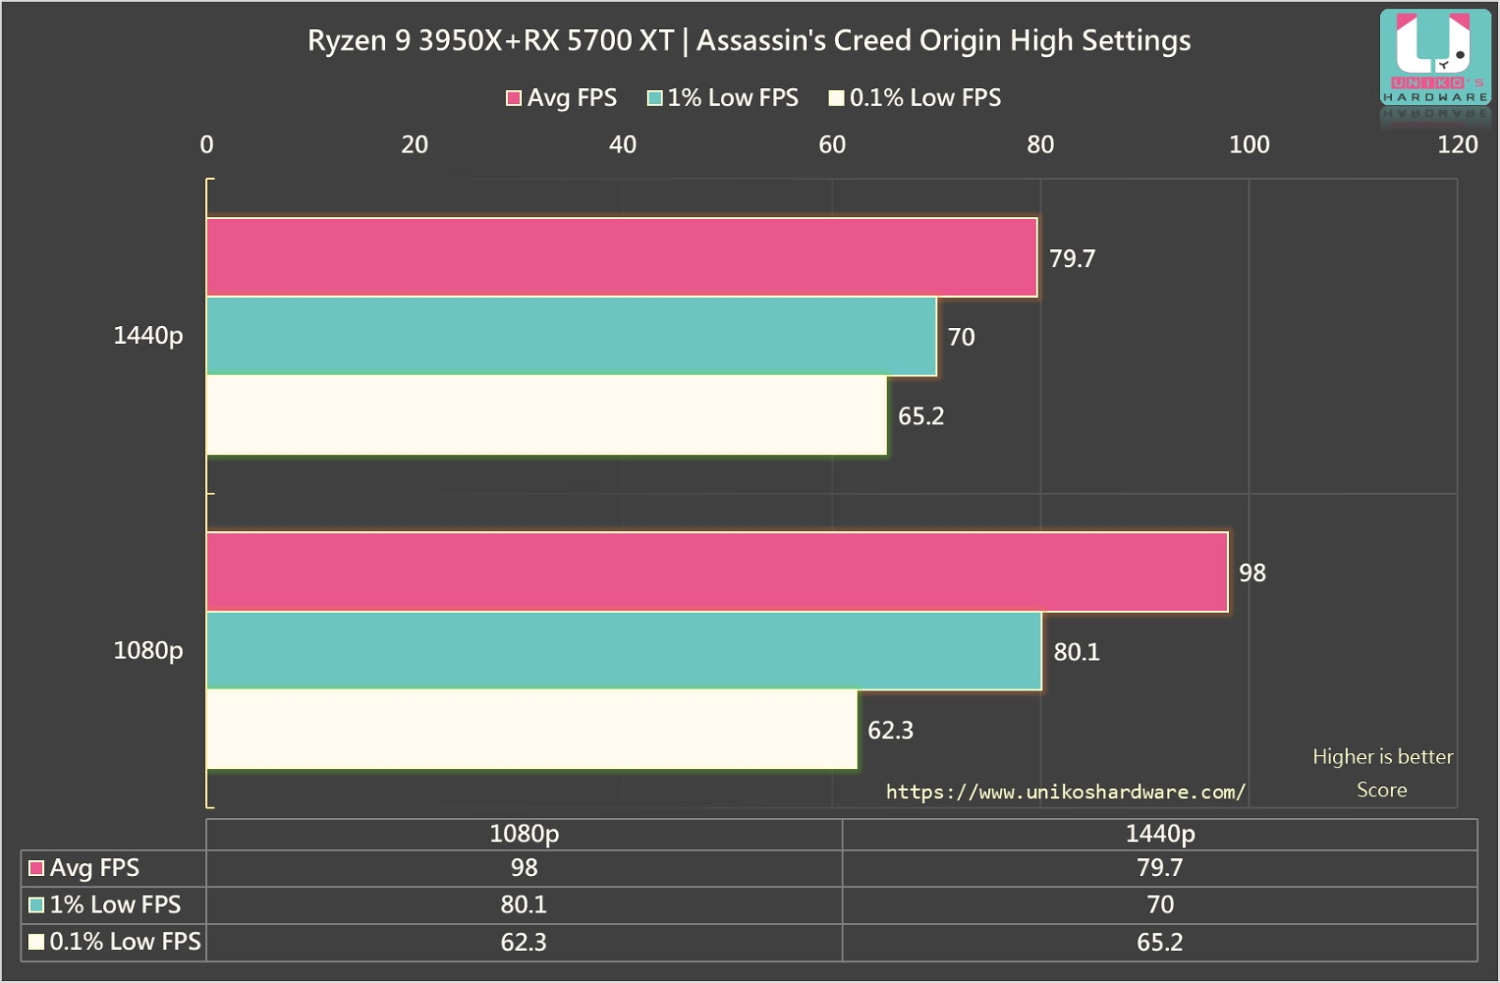
Assassin Creed Origin
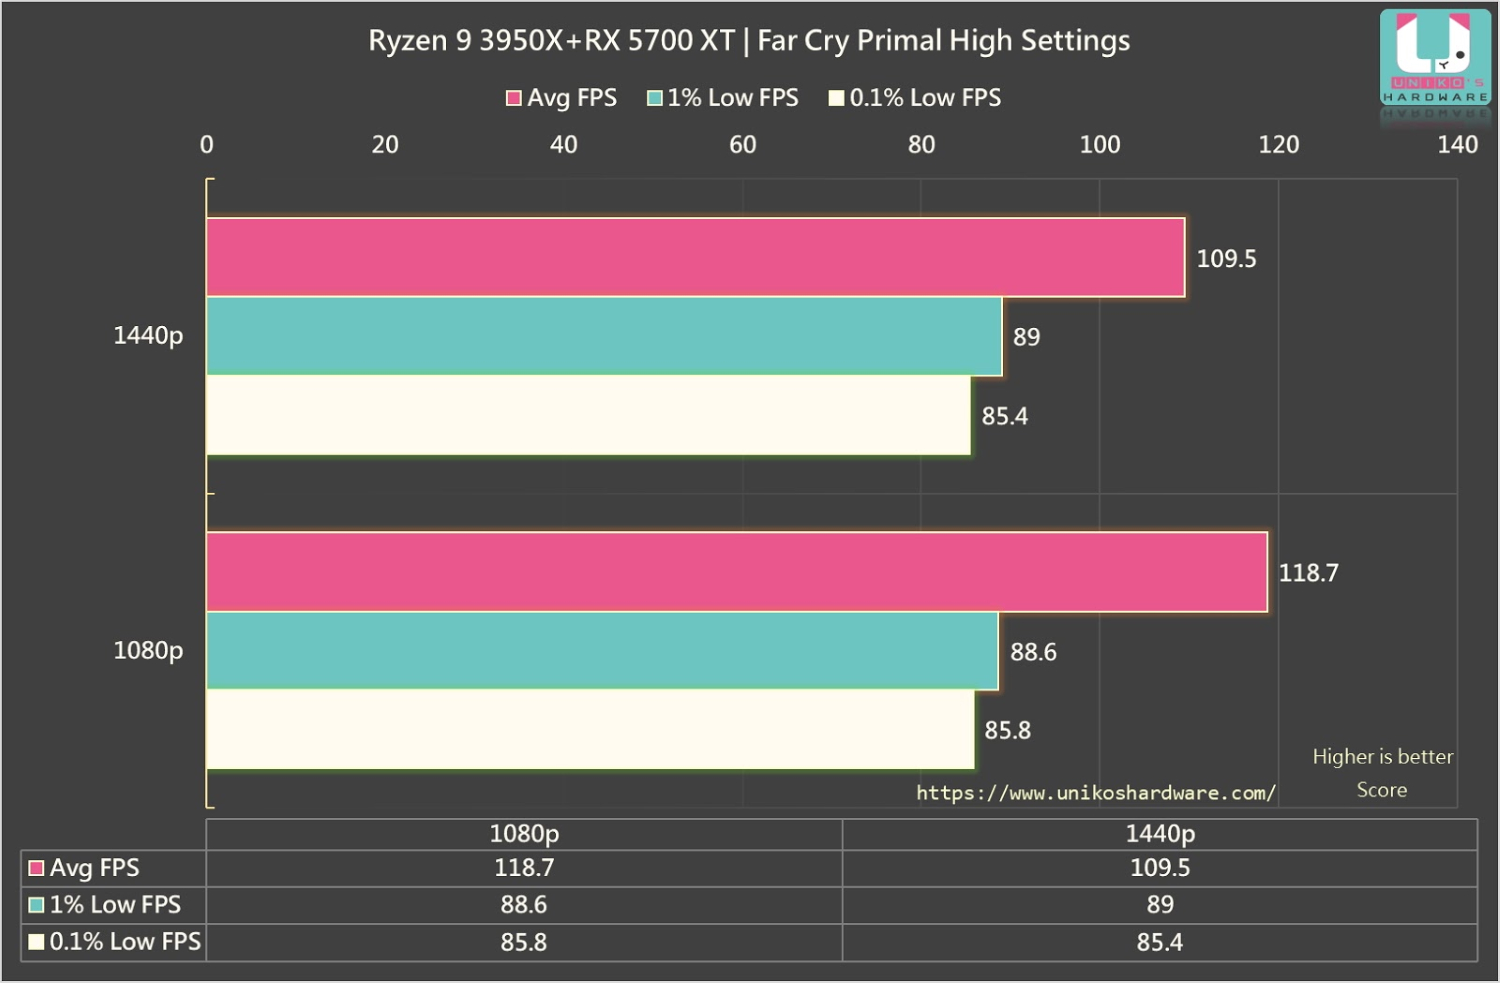
Far Cry Primal
Ryzen 9 3950X CCD / CCX latency testing
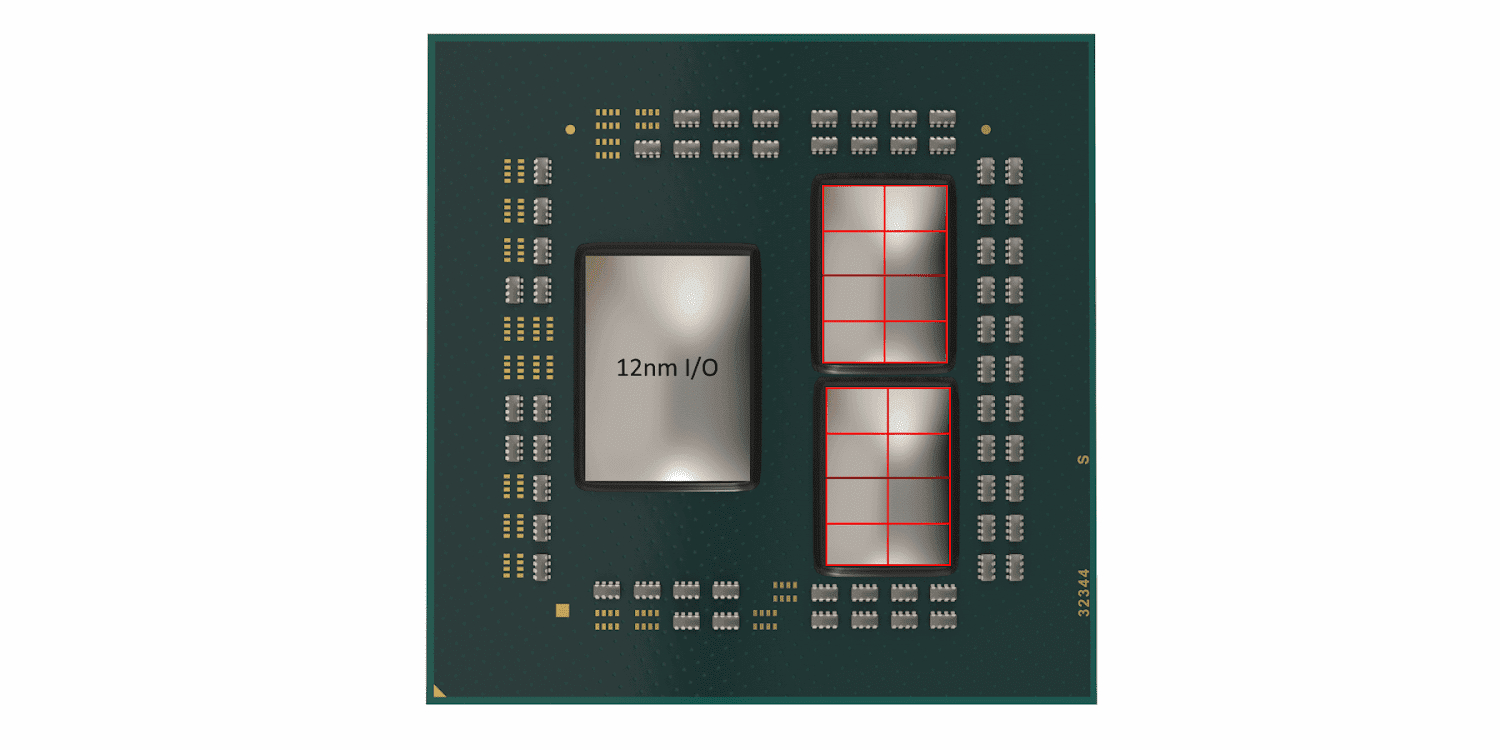
Like its predecessor, Zen2 is using the glue method to add cores. However, the core Chiplet and IO DIE are glued independently this time. As indicated in this diagram, the left one is the IO DIE, and the right ones are the CPU cores. The CPU cores are divided into two groups of CCD (core chiplet die). Each group of CCD is composed of 8 cores which form 2 CCXs (1 CCX is a 4 core grouping inside a CCD). In resume, the R9 3950X does indeed have 16 cores as this diagram indicates.
If we take a look at the previous Zen1 architecture, the latency inside the CCX should be fairly low. But, once it tries to communicate with other CCX clusters like what Threadripper ( Zen1 architecture) did with the first CCX cluster to the third or fourth CCX cluster - the latency becomes exponentially higher.
As an example, the latency between the Ryzen 7 1700’s CCXs as high as 120 ~130ns.
As for when the 1st generation Threadripper first CCX cluster tries to link up with the third or fourth cluster, the latency will drastically increase to 230ns!
Core latency results
Since the Ryzen 9 3950X have numerous cores and threads, we have only taken some reference points to make our observations:
- The latency inside a CCX has been greatly decreased (~26ns) compared to Zen1’s 40ns.
- The latency between CCXs for Zen2, in this particular case - the 3950X, has dropped to 66ns compared to Zen1’s loathsome 120ns.
- These results show that the latency between CCDs is comparable to those between CCXs or even lower in some cases. Thus, the mainstream belief that the separation of the IO DIE from the core Chiplet would cause a much higher level latency is proven to be incorrect.
In summary, these same results can also be replicated by the new Zen2 Threadripper. We cannot praise AMD enough to have made such massive improvements in reducing the latency between the different CCDs.
Conclusion
When AMD first launched its Ryzen 1000 series back in 2017, which their flagship R7 models featured up to 8 cores, it completely changed the landscape of the consumer CPU market. At that time, Intel has saturated the market with their 4 core processor releases one after another. However, AMD has changed the game rules by bumping up the mainstream CPU core count from 4 to 8.
In early 2019, AMD released its new Zen2 processors which they used TSMC’s new 7nm manufacturing process. They managed to bump up the core count even higher from 8 to 12 in only 2 years.
Even with their competitor Intel behind them in terms of core counts, AMD continues to push the limits of delivering more cores on a consumer chip.
Enter the Ryzen 9 3950X. This is AMD’s 16 core/ 32 threads crown-jewel for the mainstream AM4 platform. It nukes everything the competition has to offer at its price point.
On the other hand, Zen2 provides even better performance for the HEDT Threadripper platform in which we see the first 24 core and 36 core processors. We are also seeing the first deployment of PCIe 4.0 on both mainstream and HEDT platform, a much more expansive IO, and better power efficiency, etc... All these changes revolutionize the PC market for the better. What can we say other than AMD YES!
Uniko’s Hardware recommends this 16 core beast of a CPU!
English ver. editor XMA

